By Abhishek Vashishtha.Jun 22, 2022
Introduction
Datadog is a monitoring and analytics tool used by Information Technology (IT) and DevOps teams to determine performance metrics and event monitoring for infrastructure and cloud services. The tool can monitor resources such as servers, databases, and tools.
- In this documentation, we will be talking about how we can leverage Datadog to monitor infrastructure on the AWS cloud. We will be monitoring AWS resources like EC2 instances and RDS Databases.
- We will be creating Datadog Dashboards which helps in visually tracking, analyzing, and displaying key performance metrics, and will also take a look at how to enable monitoring, for the health of our infrastructure.
- We will also try to establish an Alerting Mechanism using Monitors in Datadog. This will help us get notified when metrics reach their threshold or things go wrong, so we can take remedial actions.
Background
For our use case, we are focusing on infrastructure in the AWS cloud. Although we have a native AWS CloudWatch service to monitor the infrastructure, but there are some limitations to using CloudWatch.
For example, there is no dedicated dashboard option where we can list multiple services and resources, which can be quite helpful in enterprise-level environments.
Taking into consideration the limitations, let’s proceed with Datadog dashboards & monitors creation with infrastructure monitoring and alerting.
Configuring Datadog
Prerequisites
As a part of the prerequisite, we need to have some infrastructure in AWS. To keep the use case simple, we would be monitoring a 2 Tier Application, which consists of an EC2 instance and a Postgres Aurora DB.
We can divide Datadog Monitoring Configuration into 6 Steps.
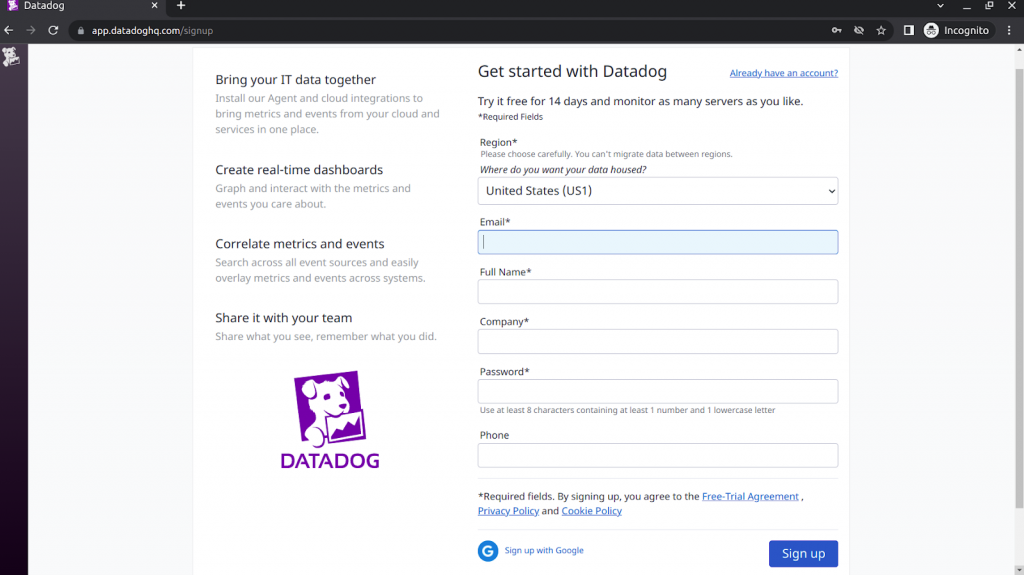
Step 1: Creating your Account on Datadog
We need to sign up and create a Datadog account.
URL: https://app.datadoghq.com/signup. At the enterprise level, we can sign in using SSO.
Step 2: Choose your Stack
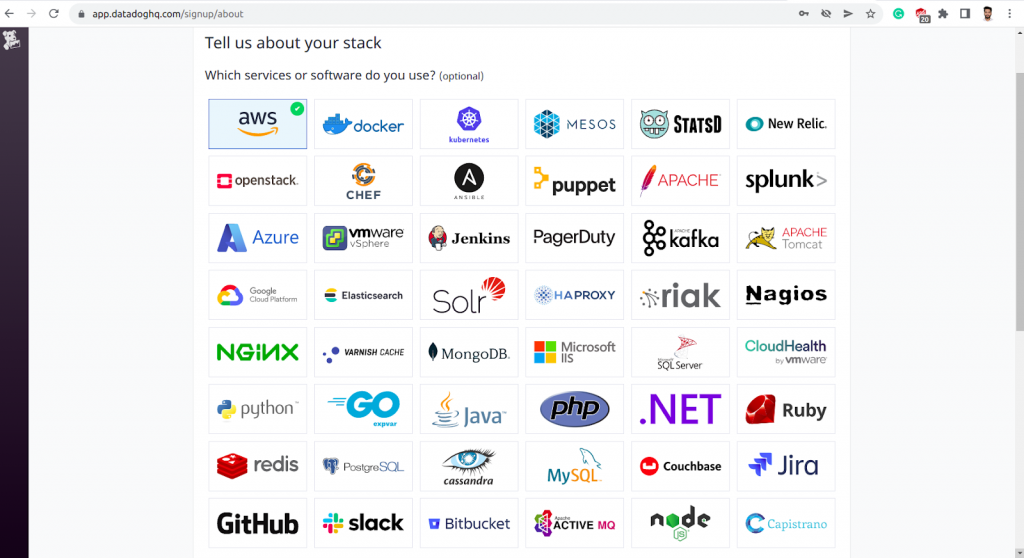
Once we are signed in, we need to choose a stack. It is nothing but a list of services and pieces of software that we can integrate using Datadog. Since we are monitoring resources on AWS, we can click on the AWS tile.
Step 3: Installing the Datadog Agent
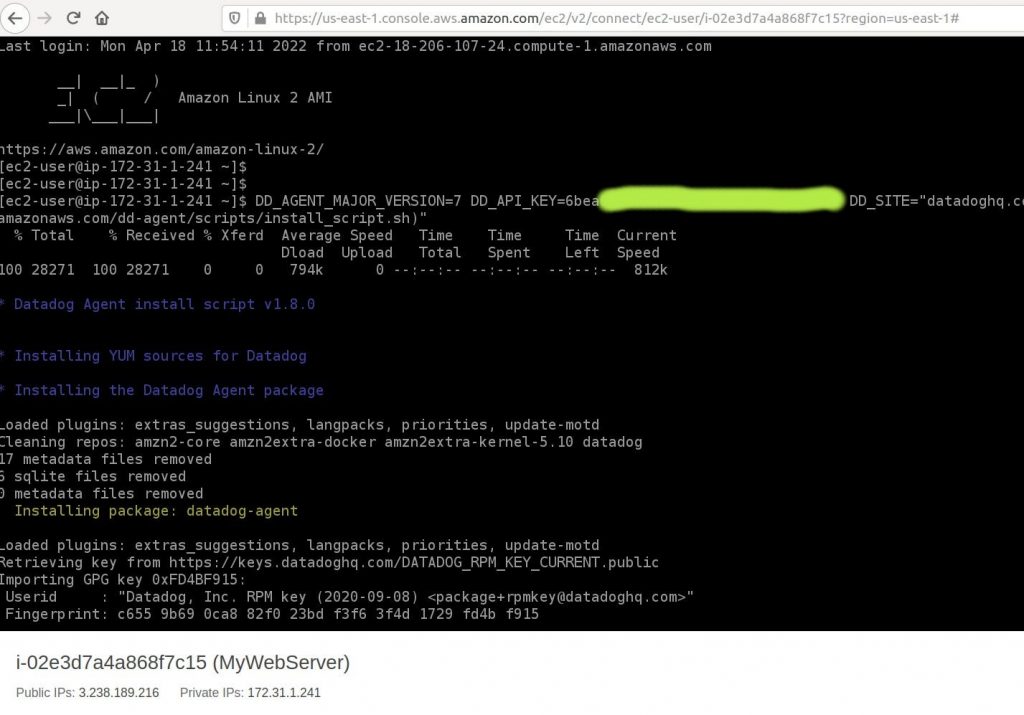
The Agent is lightweight software installed on your hosts. It reports metrics and events from your host to Datadog using integrations. An agent can be installed on a variety of platforms. In our case, since our application is hosted on an EC2 instance & that instance is an Amazon Linux machine, we can install the Datadog agent using the below command. The DD_API_KEY parameter is unique for each account & can be found under the Agents Tab of our Datadog Account Homepage.
DD_AGENT_MAJOR_VERSION=7
DD_API_KEY=6bea67e2875eb3d7b7ad4905########
DD_SITE=”datadoghq.com” bash -c “$(curl -L https://s3.amazonaws.com/dd-agent/scripts/install_script.sh)”
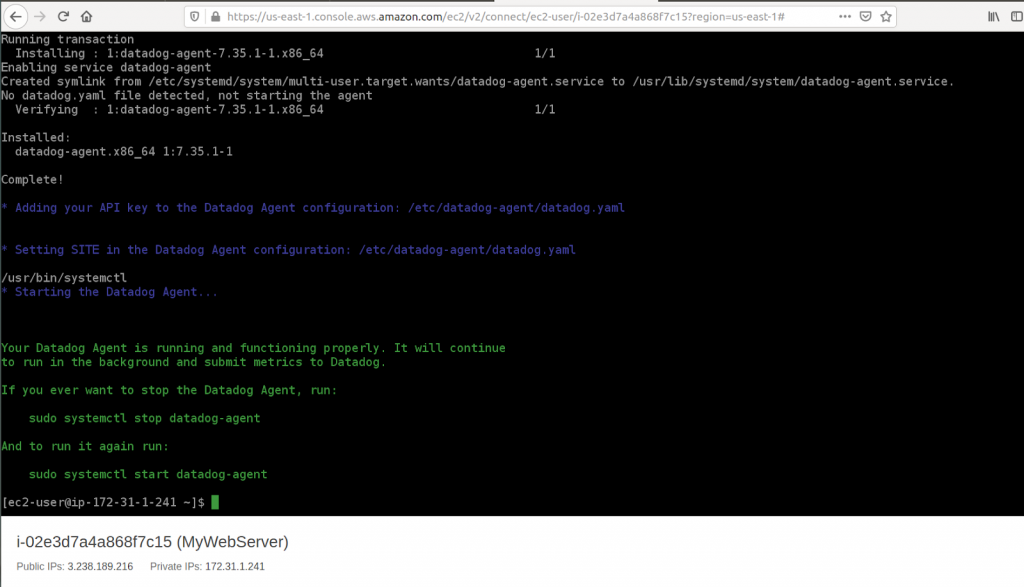
Step 4: Establishing the Connectivity between AWS and Datadog
We would be using one of the recommended approaches by Datadog for Role Delegation.
On AWS
- Create a new role in the AWS IAM Console.
- Select Another AWS account for the Role Type.
- For Account ID, enter 464622532012 (Datadog’s account ID). This means that you are granting Datadog read-only access to your AWS data.
- Select Require external ID and enter the one generated in the AWS integration tile.
- Click Next: Permissions.
- Click Create Policy, which opens in a new window.
- Select the JSON tab. To take advantage of every AWS integration offered by Datadog, use the policy snippet below. The policy has read permissions for metrics related to EC2 & RDS at the moment. With the addition of other components, the below permissions may change.
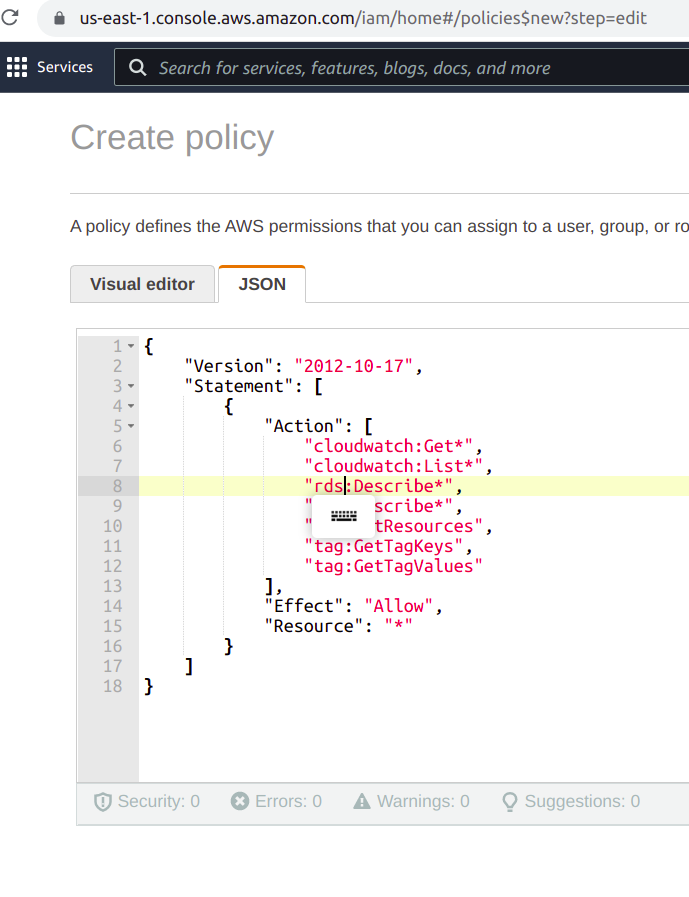
- Name the policy as DatadogAWSIntegrationPolicy or you can name it as your choice, and provide an apt description.
- Click Create policy, then close this window.
- Back in the “Create role” window, refresh the list of policies and select the policy you just created.
- Give the role a name such as DatadogAWSIntegrationRole, as well as an apt description.
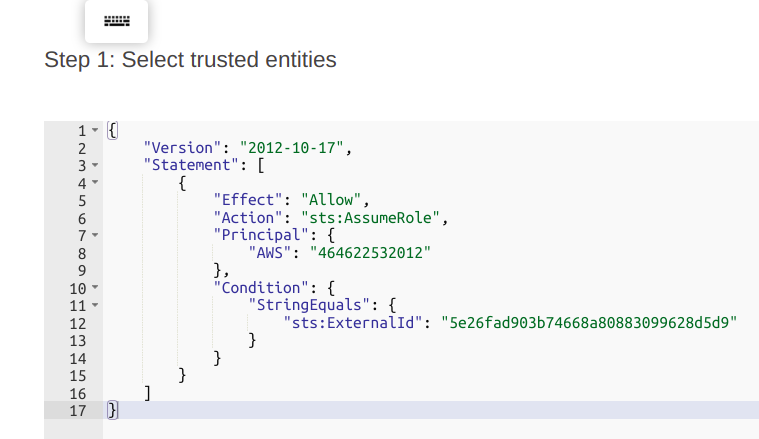
- Click Create Role.
On Datadog
- Go back to the Datadog AWS integration tile.
- Select the Role Delegation tab and select Manually.
- Enter your AWS Account ID without dashes, for example, 123456789012. Your Account ID can be found in the ARN of the role created during the installation of the AWS integration.
- Enter the name of the created role. Note: The role name you enter in the integration tile is case-sensitive and must exactly match the role name created on the AWS side.
- If the Datadog is not authorized to perform sts: AssumeRole error, make sure your AWS trust policy’s sts:ExternalId: matches the generated AWS External ID in the Datadog AWS integration tile.
- Choose the AWS services to collect metrics from on the left side of the dialog.
- Optionally, add tags to all hosts and metrics.
- Click Install Integration.
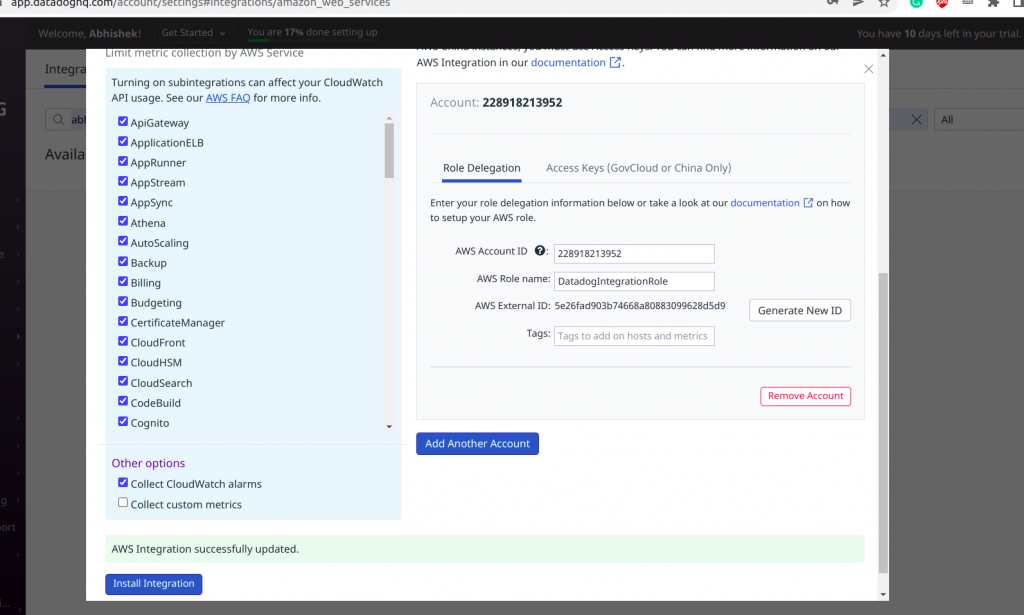
The integration is now complete and thanks to the Datadog agent, we would be able to see Cloudwatch logs being sent to Datadog.
Step 5: Creating the Dashboard
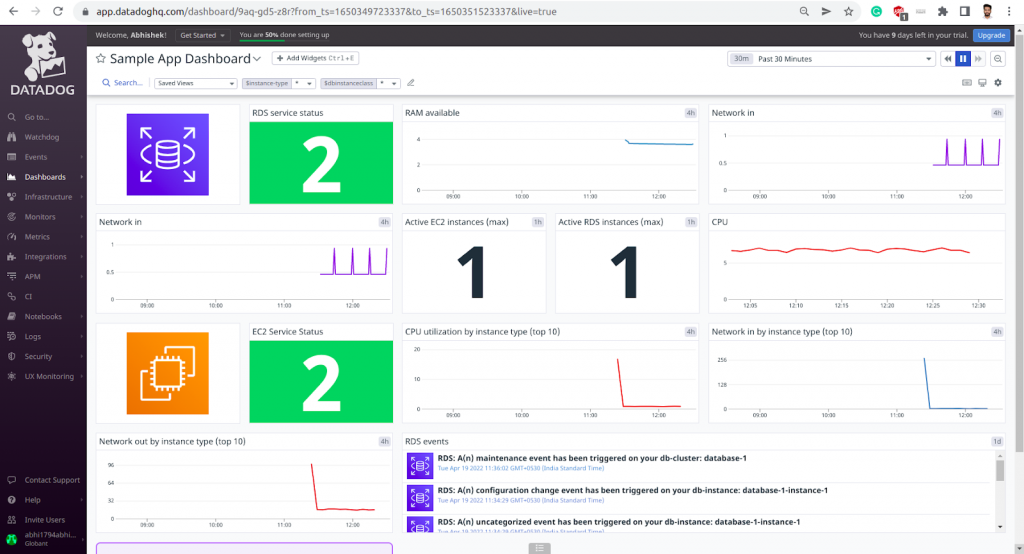
We can leverage some custom templates provided by Datadog, which is helpful comes when we are starting things from scratch. There are templates for almost every service. The widgets monitor the popular metrics and can be edited as per the use case.
We can even clone widgets to the new dashboard and update the hosts there.
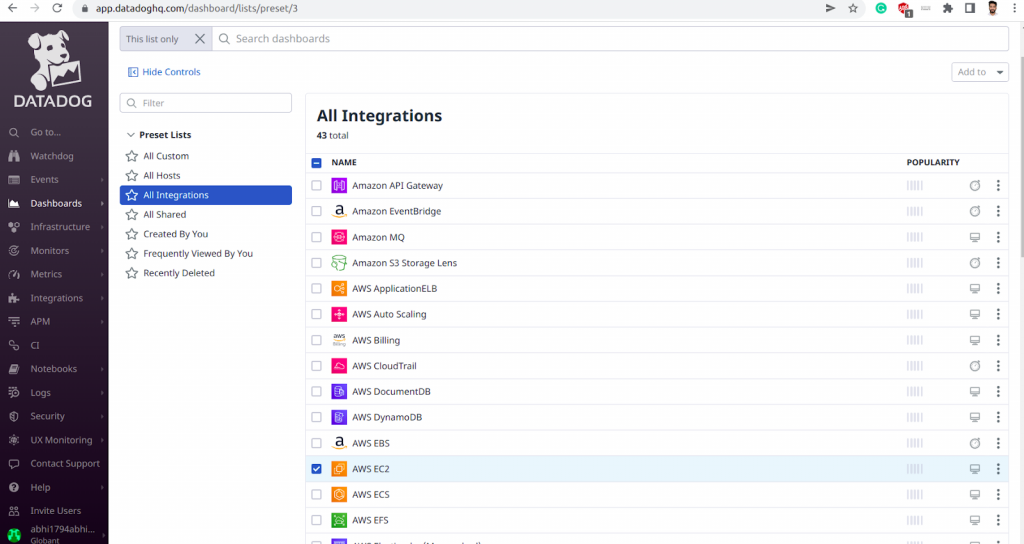
For our use case, we would be leveraging the EC2 and RDS templates and modifying those for our hosts.
To monitor specific metrics, we can refer to the Datadog documentation which lists metrics and the purpose they solve.
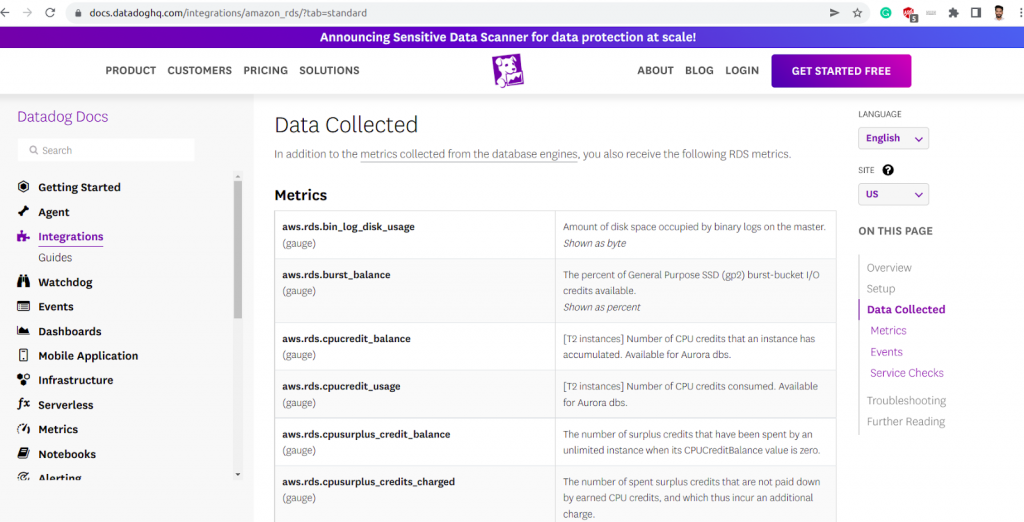
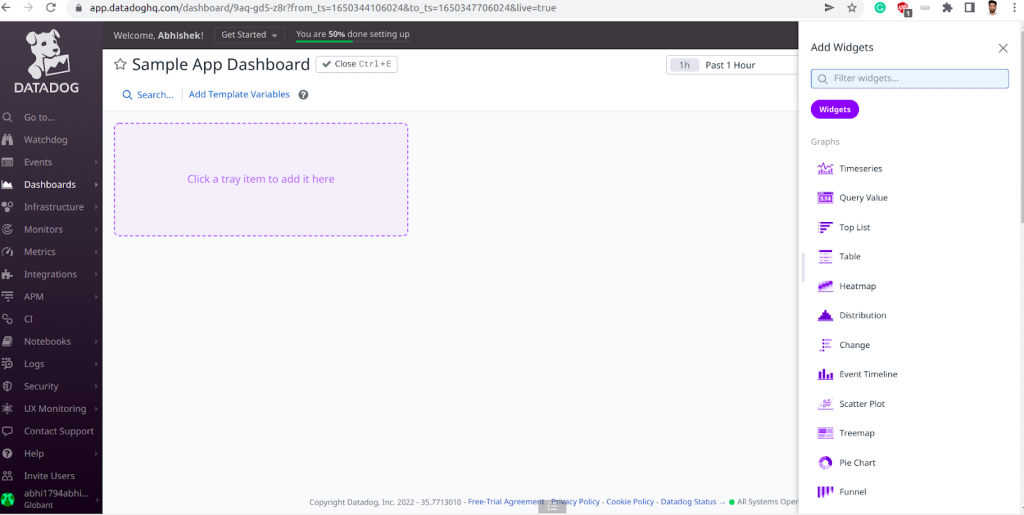
We can create an empty dashboard and start adding different kinds of widgets from the available options.
For example, if we want to monitor the CPU utilization of the Database instance, then we can refer to the documentation for the query and choose the desired database instance. We can group instances based on tags and other parameters as well.
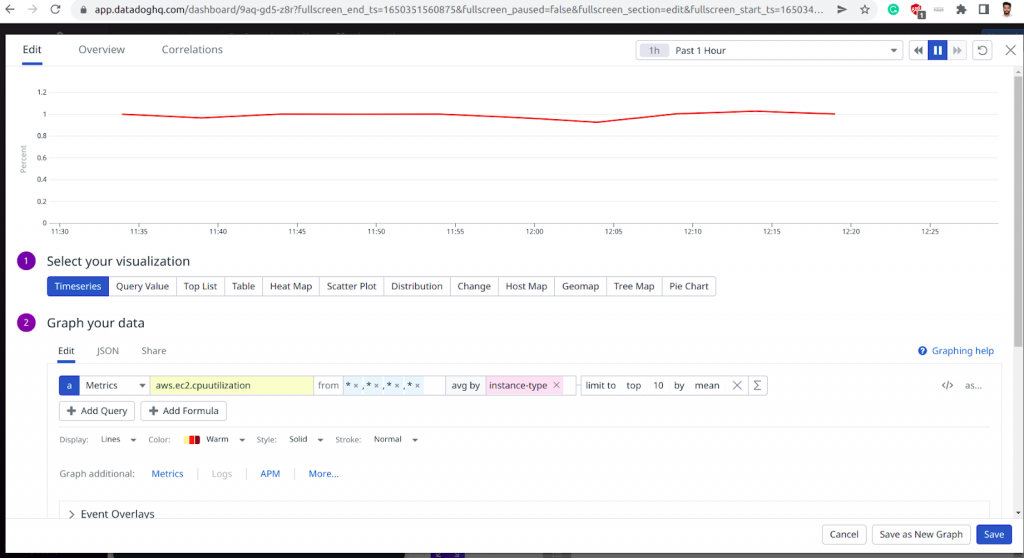
We can add the template variable section at the top of the dashboard to filter instances based on tags and other parameters.
We can refer to the documentation and keep on adding other required metrics and update the dashboard. Also, the pre-existing template makes things easy as we can start adding them to our main dashboard. Once done, we will have the Datadog dashboard ready. We can choose a time frame and toggle between monitoring metrics, and can generate a shared URL to share the dashboard across the team.
Step 6: Creating the Monitors for Alerting
We have come halfway by creating the dashboard, the next step is to get notified if the metrics reach their threshold or something goes wrong. We can set up monitors in Datadog for such scenarios.
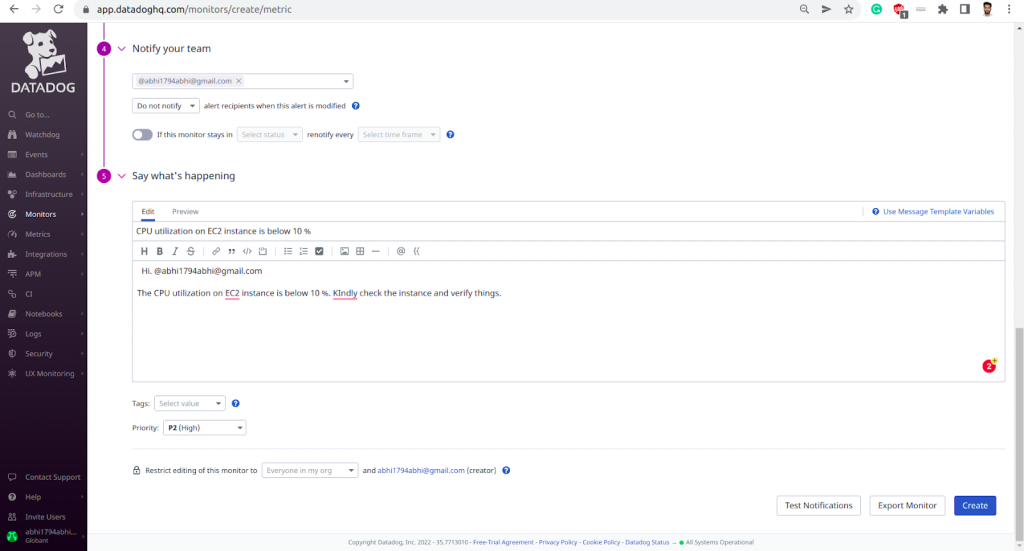
Under Manage Monitors, click on create the monitor. We need to define the metric and set alert conditions.
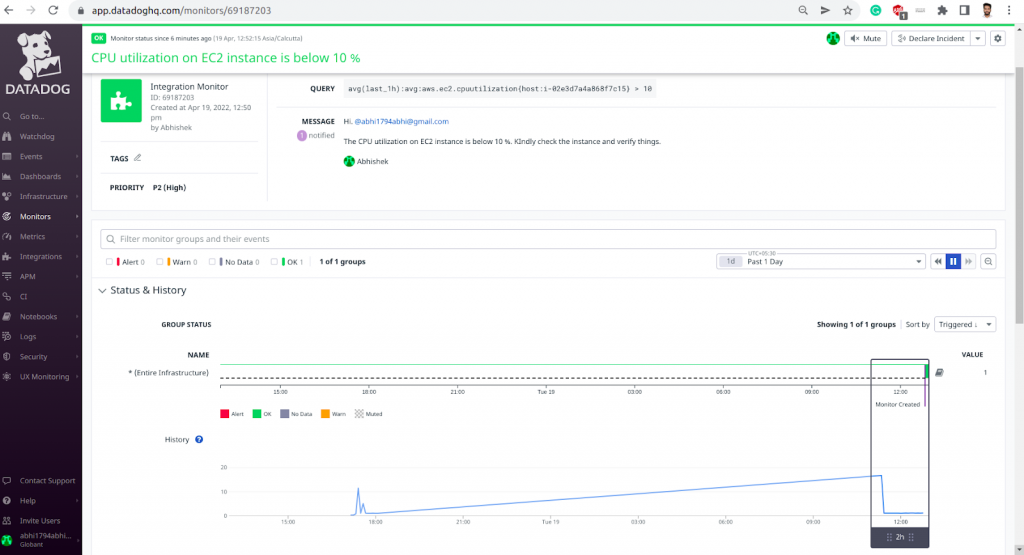
For example, we need to be notified if the CPU Utilization of the EC2 instance goes below 10%, possible reasons could be because the application has stopped working. So, we must pass the metric and the threshold value. We can even trigger an alert when the thresholds are received. The notifications are sent to the email address that we provide. It can be a team DL(Distribution List) or even a Slack group. We can even share widgets within the slack group.
Similarly, we can have multiple monitors for different use cases and can check the health of each monitor from the Manage Monitors section. We can also create a separate dashboard to manage all the monitors, check their health, verify the monitors which are in an alert state, and a variety of other things. But that is something for a separate discussion or maybe a child article on this page 🙂
Pros/Cons
Datadog is helpful as a Cloud monitoring platform that provides a unified solution to seamlessly combine the three pillars of observability and enable full visibility across our application stack. Other than that, the most important thing is the smooth, frictionless integration process with more than 400 built-in integrations and pre-defined dashboard templates built for them. There are multiple products within Datadog to support different use cases at each layer of our applications and provide a single pane of glass across different teams within the organization
Regarding Cons, all these features come with a price. Datadog prices out at around $15 per user per month, roughly, and it is $23 for the Enterprise version. Datadog has an open pricing policy with published prices and generally low prices. It’s pricing per-month options include per host, per million events, and per GB of analyzed log files.
To sum up, it completely depends on the use case that you are trying to achieve.
Conclusion
Infrastructure Monitoring is a must-have property for modern applications to gain full visibility across the stack. The three pillars of observability namely Monitoring, Alerting, and Remediation are often required to be correlated to get the maximum benefits. Thus, selecting a monitoring platform with a unified view that consolidates all three observability pillars comes ready in handy to deal with unforeseen circumstances.
References
The Datadog documentation is the right place to refer for more detailed information on what is explained regarding Datadog services. The following links were referred to as part of creating this document.
- https://docs.datadoghq.com/integrations/amazon_web_services/?tab=roledelegation
- https://docs.datadoghq.com/integrations/amazon_ec2/
- https://docs.datadoghq.com/integrations/amazon_rds/?tab=standard
- https://docs.datadoghq.com/monitors/
The original article published on Medium.
