By Maria Golubeva.Nov 9, 2022
Good day everyone! I have started my journey on Medium with not a professional topic, but with a short story about personal experience in Tenerife that we went through with colleagues from Jagaad (you can read it here). Today I would like to introduce myself as QA Engineer and share my professional experience.
Nice to meet you all

My expertise
In 2018 I have graduated from the University of Informatics and Radioelectronics in Minsk, Belarus. But I started my first job as a QA Engineer at the beginning of my last year at the university, so I already have 5 years of work in the testing world(web, mobile applications, API) on projects with various technologies, team compositions, development models. Learn more about my experience and lifestyle you can on LinkedIn. I’m currently the only Full Stack QA Engineer on a web application development project for a big tour operator.
My main responsibilities
- Requirements analysis and preparation of test documentation, test data;
- Manual testing of new functionality;
- Preparation of test plans to automate critical functionality that needs frequent regression;
- Implementation E2E tests with JavaScript;
- Support and updating of E2E tests;
- Analysis of daily automatic test run and bug report descriptions;
- Conducting a retest after fixing bugs and confirming the release to production;
- Support for UAT acceptance testing with stack holders;
- Development and support of Browser Synthetic Tests with DataDog.
What is this article about
Today I would like to share my experience of using one of the most powerful features of Datadog, which allowed me to sleep peacefully at night without worrying that for any reason the production would suddenly stop working, and the team would only know about it through the process of reporting a bug from the user, which usually takes several hours. Because, what I will tell you in this article, will inform you about a critical situation in production within a few minutes after it happened. Let’s go in order!
What is DataDog and its features
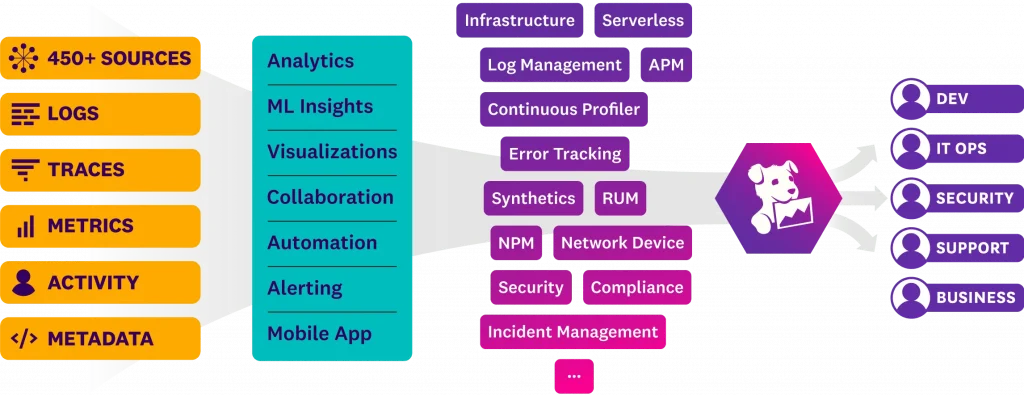
Datadog is a monitoring and analytics tool for information technology teams that can be used to determine performance metrics as well as event monitoring for infrastructure and cloud services. The software engineers can monitor services such as servers, databases and tools.
The user interface includes customizable dashboards that can show graphs composed of multiple data sources in real-time. Datadog can also send users notifications of performance issues on any set metric. Users are notified through means such as email, Slack or PagerDuty.
The features that Datadog offers
- Provides an IT/DevOps team with a single view of their infrastructure (including servers, apps, metrics and other services);
- Customizable dashboards;
- Alerts based on critical issues;
- Support for over 250 product integrations;
- Automatically collects and analyzes logs, latency and error rates;
- Allows for access to the API;
- Supports applications written in languages such as Java, Python, PHP, .NET, Go, Node and Ruby.
Synthetic Testing Overview
What is Synthetic Testing
Synthetic testing/synthetic monitoring is a way to identify issues with main user scenarios and application endpoints before they user experience.
Datadog Synthetic Monitoring allow you to create and run API and browser tests that proactively simulate user actions from different browsers, devices, and locations around the world. You can detect errors, identify regressions, and automate rollbacks to prevent issues, that user can face.
Datadog offers API tests, Multistep API tests, and Browser tests.
Advantages of using the DataDog tool for creating synthetic tests
- Code-free tests. It’s not necessary to know programming language to create synthetic browser test, web recorders allow any team member to independently create and run tests.
- Managed and private locations. Running tests from a variety of locations helps ensure that all of your users can access your application, no matter where they are in the world.
- Alerts. Synthetic testing platforms typically integrate with email and other communication tools, so you can route notifications to the right teams when a test fails.
- Visualization tools. Effective synthetic testing platforms enable you to keep track of synthetic test results with dashboards, graphs, and other visualizations.
My personal experience
Why I have defined using Datadog monitoring as an essential possibility and an integral part of QA process?
Now the production environment of application, the whole team is working on already 2 years, is under control of synthetic test every 10 minutes. There are a big amount of users all over the world and we have to ensure the smooth running of the application.
And in case of tool is not accessible by any reasons, we receive a notification in slack channel, where there are Product team, Technical support team, QA team, who take immediate corrective action after an incident.
Getting Started with Synthetic Browser Tests
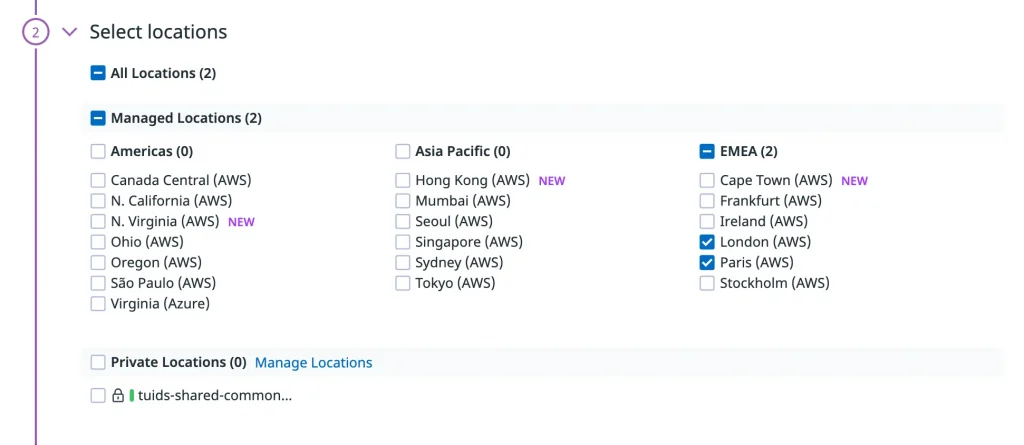
As an example I can’t show you the tool I’m working on with my team now. But it’s a pleasure to use my favourite https://runaway.jagaad.com/ website and explain to you how easy it is to implement. We are going to check every 10 minutes from two locations (London, Paris), that main pages of https://runaway.jagaad.com/ are available.

Create a test
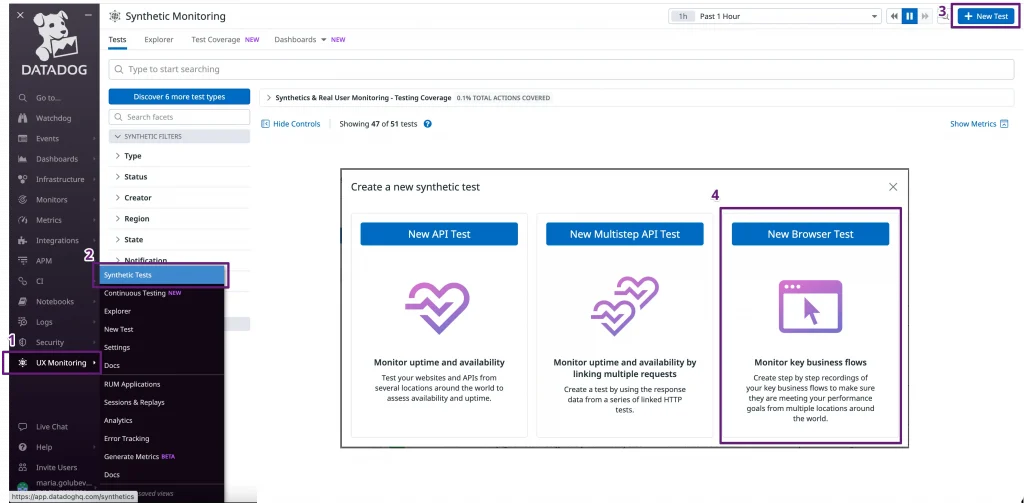
- Find the UI Monitoring menu option > Go to Synthetic Tests section;
- In the top right corner click on the New Test > New Browser Test.
Set test details
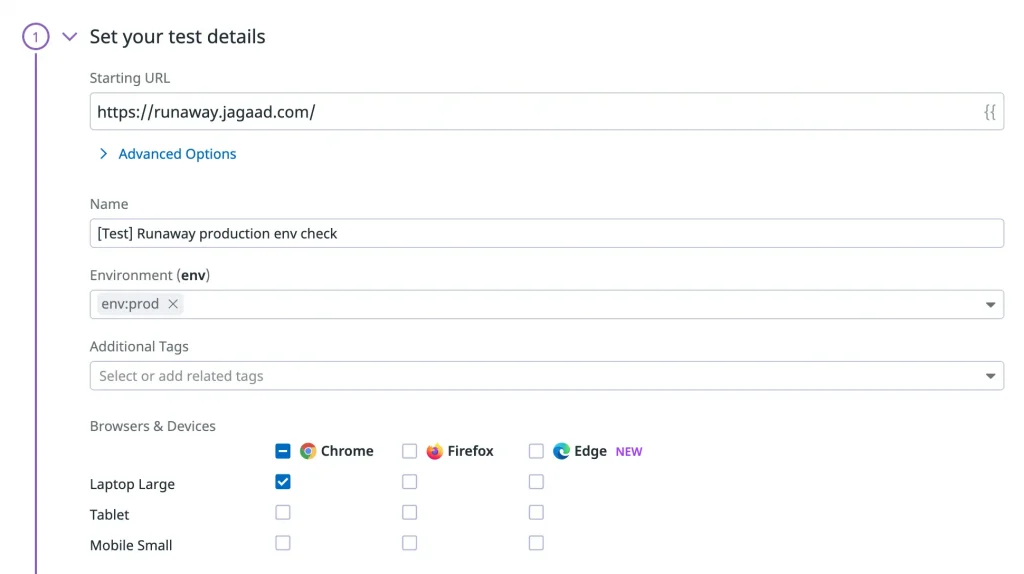
- Add the starting URL of the website you want to monitor;
- Name your test and set tags to it such as env:prod and app:runaway. Tags allow you to keep your test suite organized and quickly find tests you’re interested in on the homepage.
- Choose the browsers and devices you want to test with: Chrome, Firefox, Edge and laptop, tablet, mobile.
Select locations
Select one or more Managed Locations or Private Locations to run your test from. In the links you can read more.
Specify test frequency
Select the frequency at which you want your test to execute.

Define alert conditions
You can specify the number of consecutive failures that should happen before considering a location failed.
You can also configure your test to only trigger a notification when your application goes down for a certain amount of time and number of locations.

Configure the test monitor
Design your alert message and add an email address you want your test to send alerts to.
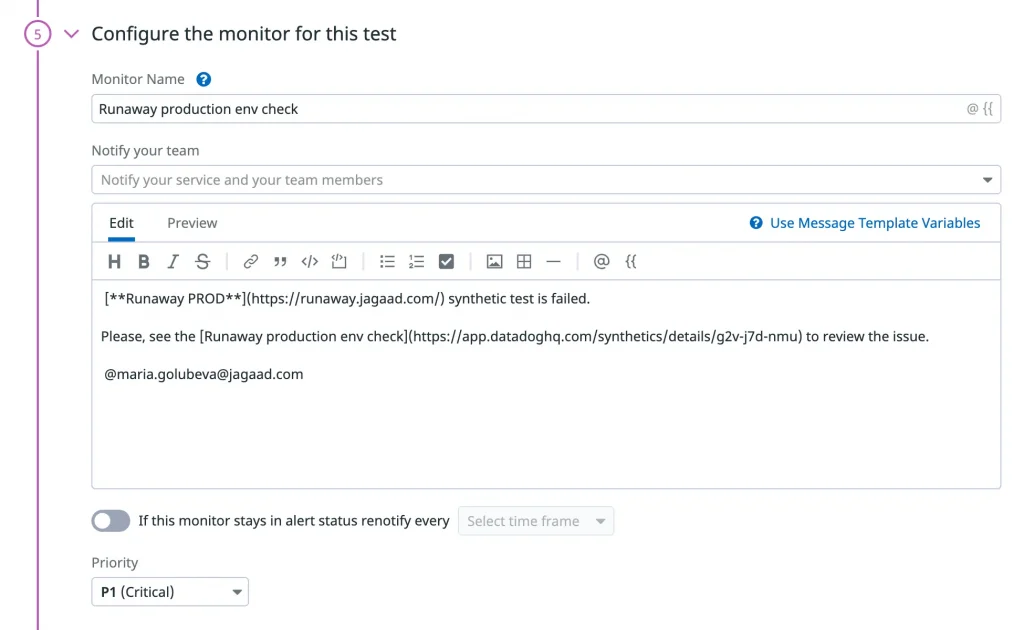
You can also use notifications integrations such as Slack, Microsoft Teams, etc. In order to trigger a Synthetic alert to these notification tools, you first need to set up the corresponding integration.
When you’re ready to save your test configuration and monitor, click Save & Edit Recording.
Record test steps
It’s a time to specify test steps, that we would like to run in scope of Synthetic Test.
Test scenario:
- Open the home page of https://runaway.jagaad.com/ website
- Test that runaway logo is present
- Test that all sections are present
- Test that ‘What happened in Sorrento’ button is present
- Click on the ‘What happened in Sorrento’ button
- Test that the content of title is ‘Jagaad in Sorrento’
- Test that all page sections are present
- Test that ‘View next Runaway’ button is present
- Click on the ‘View next Runaway’ button
- Test that ‘What happened in Tenerife’ button is present
- Click on the ‘What happened in Tenerife’ button
- Test that the content of title is ‘Jagaad in Tenerife’
Start recording
Follow all the steps described in the script (button clicks and transitions).
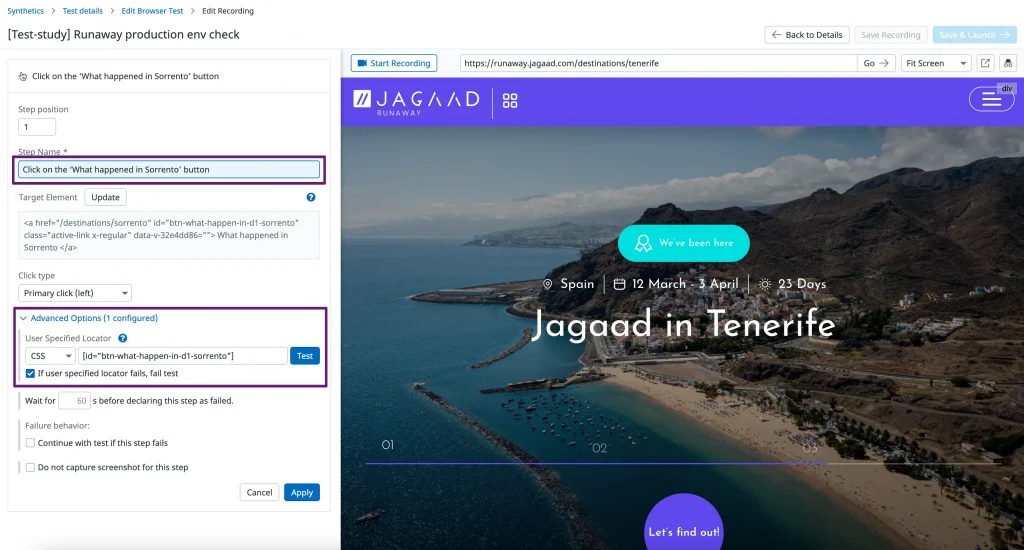
Add assertions
There are some types of assertions:
- Test that an element is present;
- Test an element’s content;
- Test an element’s attribute;
- Test that some text is not present on the active page;
- Test that some text is present on the active page;
- Test the content of the URL of the active page;
- Test that an email was received;
- Test your UI with custom JavaScript;
- Test a downloaded file.
Add all required assertions, described in the test scenario.
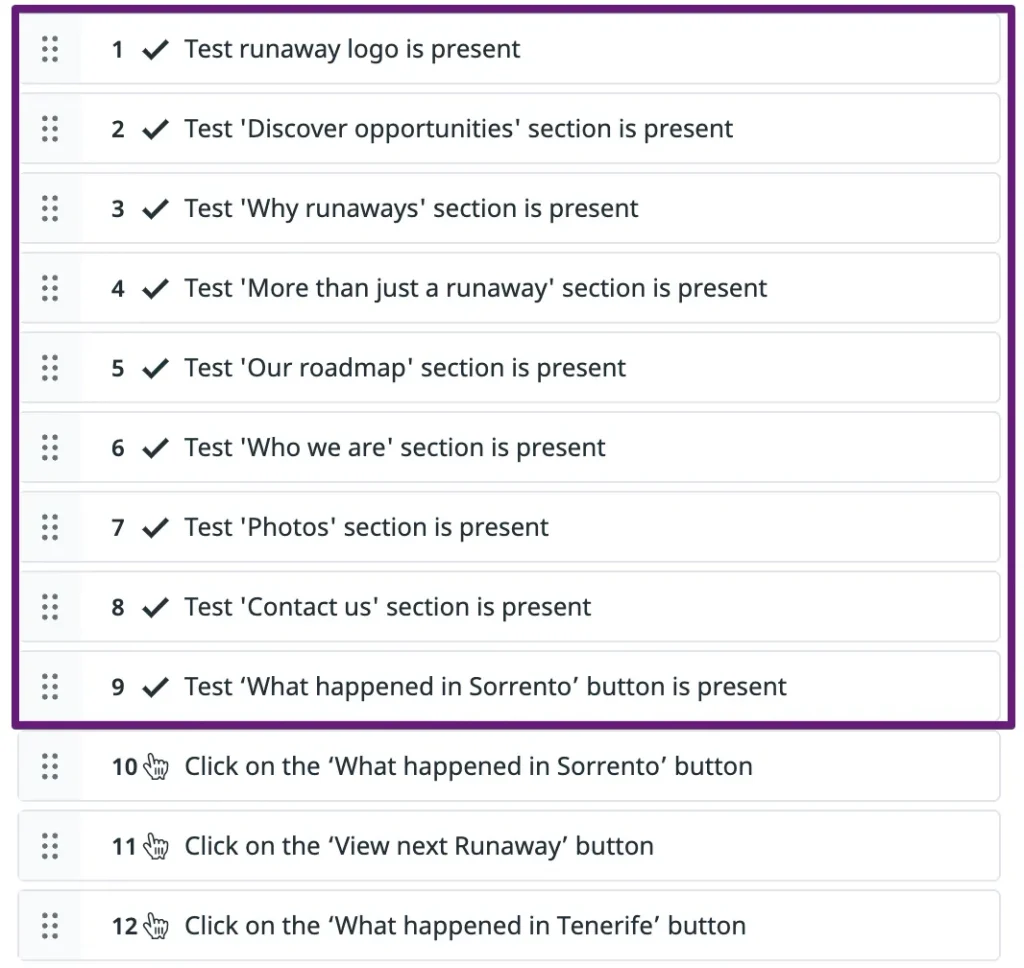
Use variables
In order not to keep the text inside the test steps, I suggest creating a variable.
Save & Launch
Everything is ready!
Well done! Now we can keep track on what is happening, how often test is running, all the details about failures.
Alerts
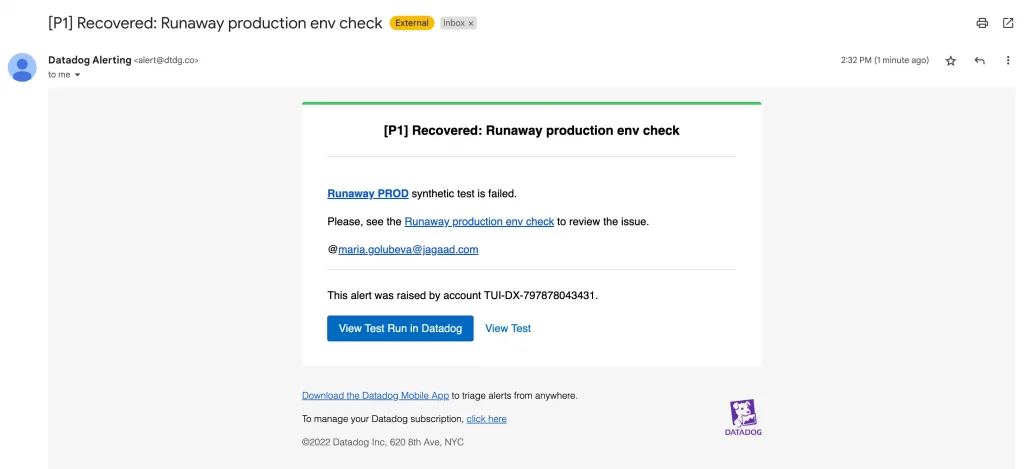
And the most useful part is alerting! Since we have defined the rules of alerting, the email to send notifications, every time when the notification conditions are met, you will receive a message by mail.
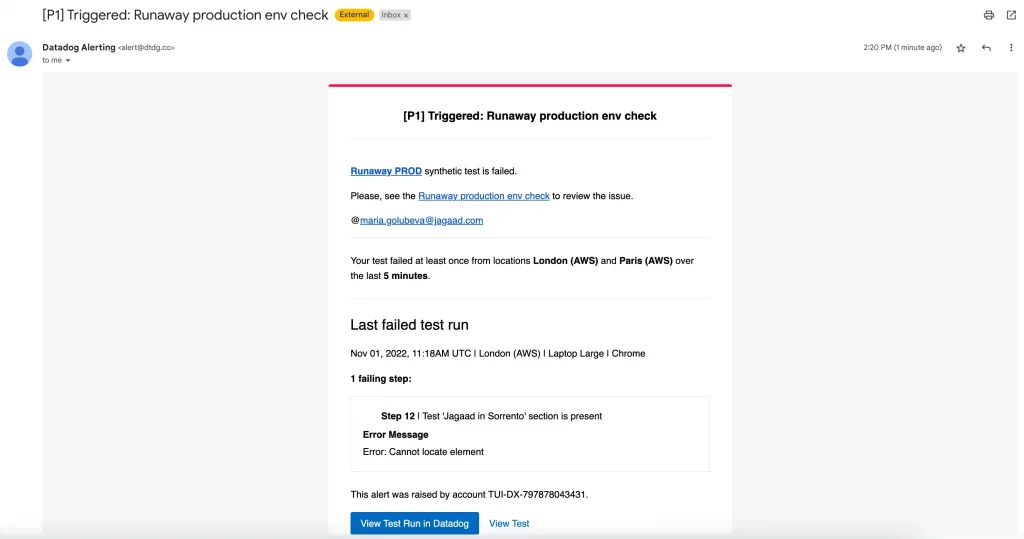
You will also be informed when the test has started working smoothly again.
How to notify whole team
The integration with other platforms, where it’s possible to be notified, you can find in google, here you will get the Slack integration really quickly.
Thank you for attention!
The original article published on Medium.
