By Xing Du.Apr 17, 2023
This week at work, I discovered a feature from Datadog that I had wanted for a long time: “Metrics without Limit.”
Problem with Metrics Tagging
One of the significant features of Datadog is metrics. It’s one of the three types of telemetry data and is the most difficult to balance between granularity and cost. For custom metrics (the premium type that gets billed): tags provide dimensions to filter and aggregate metrics, but it gets expensive quickly.
The number of unique custom metrics is recorded hourly and then aggregated(averaged in this case) over a full calendar month to be used as the volume for billing, and unique is defined as “per tag combination”
For example, if you have a metric called http.server.request.count and it has a host tag and a env tag. The application (metric emitter) lives on 3 different hosts and 2 different environments; then, you’ll end up with 2 * 3 = 6 custom metrics for billing purposes.
With metric creation (and tagging creation) completely driven by the client side (applications and dd-agent), this gives applications the full power to decide what their metrics will look like on Datadog backend. Unfortunately, the application developers don’t always know how Datadog custom metrics billing works, and they may not be the people who pay the bills for Datadog.
If a change added a high-cardinality tag to an existing metric, chances are this won’t get noticed until weeks, if not months, later. Identifying and correcting the source is always the best solution to stop this abuse. Still, with legacy services in the picture and sometimes unclear ownership, this approach may not be that easy.
At the end of the day, there’s no way for a Datadog account admin to “filter” custom metrics and/or tags used for custom metrics. And this is where “Metrics without Limits” comes to help.
Solution with “Metrics without Limits”
Metrics without Limits split custom metrics into “ingested metrics” and “indexed metrics”, allowing per-metric configuration to refine and optimize your tags and aggregations.
As the name suggested, “ingested metrics” is the original volume of custom metrics sent using code. In contrast, “indexed metrics” refers to queryable metrics in Datadog based on Metrics without Limits configurations. When it comes to billing, “ingested volume” and “indexed volume” are recorded separately, and they’re billed at different rates.
I can’t speak for every organization since different usage commitments get different discounts, but based on the pricing rate data I have, the rate for “ingested” is 2% of the cost of the rate for “indexed” (before “Metrics without Limits”, all ingested metrics are indexed, and are priced at the indexed rate).
Using an example to walk through the difference:
My metric usage is 10000 per month, coming from a single metric. Before applying “Metrics without Limits” configurations, my bill is $500 ($5 per 100). By applying “Metrics without Limits”, I reduced the “indexed volume” from 10000 to 400: 10000 ingested volume and 400 indexed volume. This gives me 10000 * $0.1/100 + 400 * $5/100 = $30
How to get started
Using Web UI
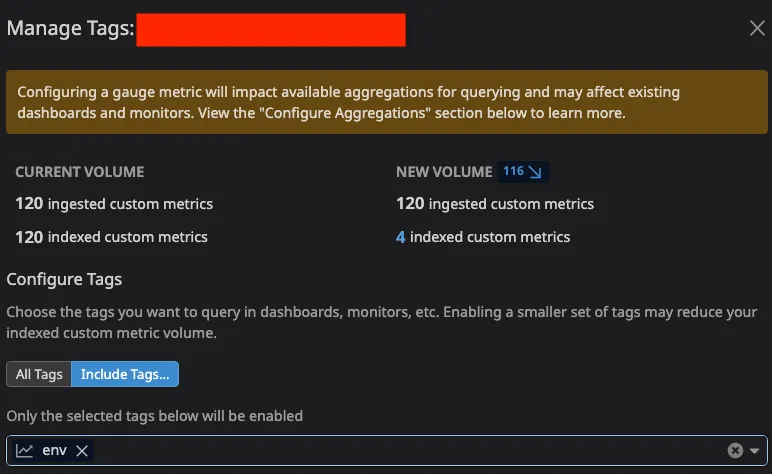
Go to “Metrics Summary” and pick the metric of your interest. Expand the details page and click “Manage Tags” or use the quick navigation button on the right.


After that you can configure via the interactive UI:

Using terraform
use datadog_metric_tag_configuration resource.
Room to improve
This is a feature that I have wanted badly since 2017-ish and the current version is still going through iterations.
- “Include Tags” is not as convenient as “Exclude Tags”. From a user’s end, I would consider configuring this if one or a few tags have high cardinality and I want to exclude those for a lower bill.
Results
I was able to reduce the usage of some custom metrics that I’m unable to identify the source/origin:

The original article published on Medium.

在〈Datadog: Metrics without Limit〉中有 1 則留言
[…] clindamicina fosfato para que sirve[…]
clindamicina fosfato para que sirve