Last year I shared an example on how to realize application tracing in Kuberntes with Istio and Jaeger. After that, the industry has made some substantial headway on this front and we are seeing more vendor support as a result. At Buffer, since we primarily use Datadog for Kubernetes and application monitoring, it’s only fitting to complete the circle with Datadog APM and Logging. I had a chance to create a small example for the team and would very much love to share with the community.
Okay, without further ado, let’s dive in!
Installing Datadog agent
First thing first, in order to collect metrics and logs from Kubernetes a Datadog agent has to be installed in the cluster. The Datadog team made this quite easy for us. There is not much more than following this guide. I’d recommend deploying as a DaemonSet because that’s all we need. The host level deployment is for something else outside of the scope of this post. If you really want to know, it monitors more metrics on the cluster level using kube_state_metrcis.
Since we will need both APM and Logging to be enabled, there are 2 environment variables need setting on the DaemonSet.
For APM (tracing)
Under the container environment variables section, add this one
- name: DD_APM_ENABLED
  value: 'true'
For logging
Similar to APM, we will need to turn on the flag to tell the Datadog agent to capture logs
- name: DD_LOGS_ENABLED
  value: 'true'
Super easy so far yeah? Let’s try to keep it that way! Now we can safely assume the Datadog agent will do its job. Let’s move to the application instrumentation.
Instrumenting for APM and logging
I have a dream that one day this major step could be completely skipped. Imagine if there is a way for a monitoring agent to tap into another runtime without needing to worry about security. Unfortunately, that’s not quite possible for now despite things have already improved A LOT. In this example, I thrive to provide the simplest way to get things started. That’s my promise to you.
Now, let’s take a look at the code (in node.js)
For APM
That’s all we need! Line 1–7 tells the package to send traces to the Datadog agent currently installed on the host ( process.env.DD_AGENT_HOST) on port 8126. I will show you how to set up the environment variable shortly in a later section. Kudos to you who spotted this!
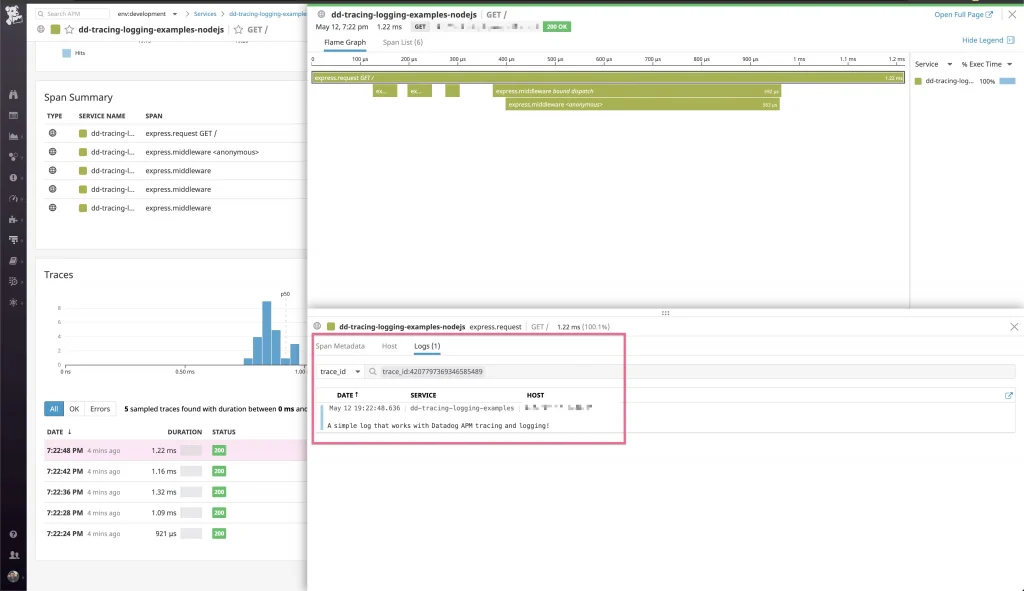
Line 5 is quite magical in my opinion. The flag will combine a trace with associated logs generated during its execution. They will be represented nicely on the Datadog interface. With this, we will be able to diagnose a lot more effectively.
Line 6 will put traces to analytics so they can be tagged, searched for convenience.
That’s it for the APM part. I hope it’s simple enough. Now let’s move on to the logging.
For Logging
Guess what? No instrumentation is needed at all. Just use a logger of your choice (I used Winston) and the Datadog agent happily picks things up automatically. In my example I didn’t even log things on the file level. All I had to do was from Line 10–13 to create a format that adds a tag to each log. This will help us to filter logs in interest much more easily.
So far so good? Now let’s talk about the actual deployment to Kubernetes.
Deploying the app
I love simplicity. I hope we are still on the same page. The Kubernetes deployment file is also very straightforward.
If you still remember the environment variable that tells where dd-trace should send metrics to. Here is where the magic happens. Line 17 – 21 sets the host IP as an environment variable that could be used by the application.
Trying things out
Something I learned is Datadog APM does not always generate a trace for each request. Instead, requests are sampled. Precisely because of this, we cannot expect hitting an endpoint for a few times to see traces generated. This, however, can be worked around if we use a simple benchmark tool. In here let’s use Apache Benchmark
This will throw 100 requests to the application to ensure some traces will be generated. In my experience, around 6–10 traces will be generated as a result. That’s quite enough for a PoC.
Profit
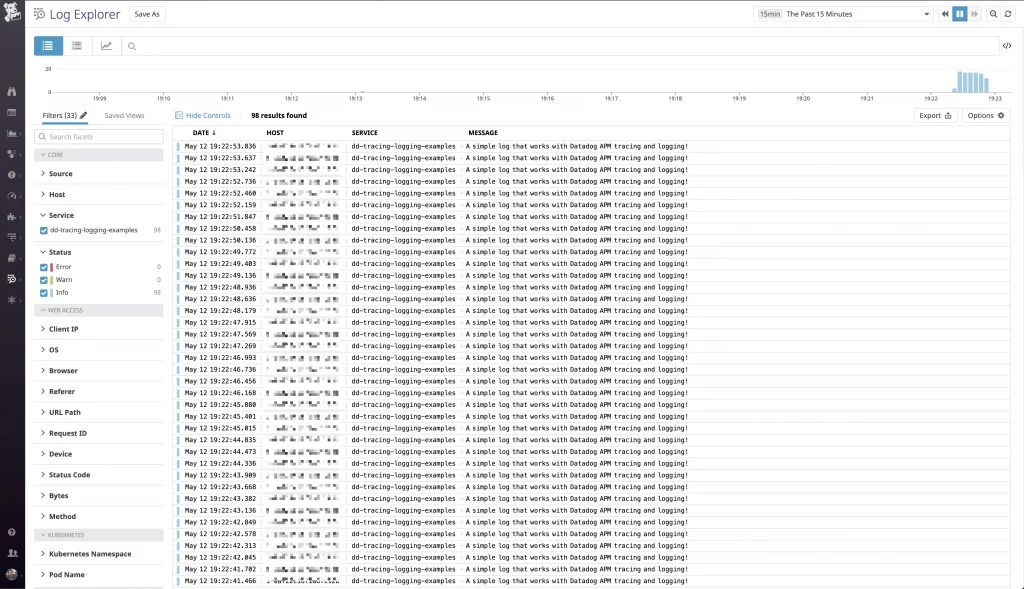
Now, with everything set up correctly. Let’s see what we will see on the Datadog UI.

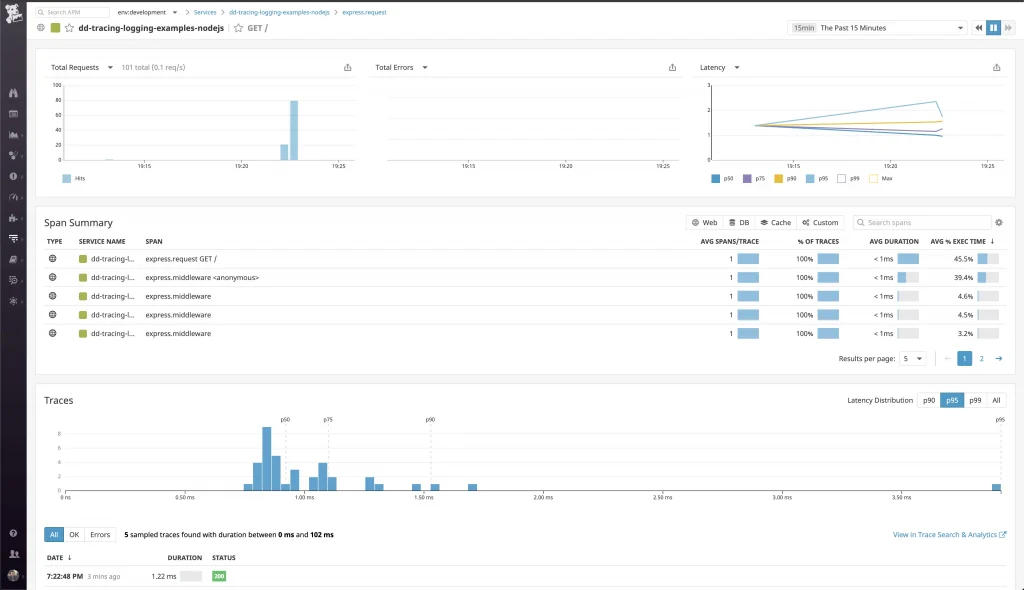
Cool! The logs are pouring in. Let’s take a look at the traces!

Awesome! They are here too. And the best part is they are already associated with the logs generated during the runtime. That’s it! Nice and easy!

Closing words
We all love Kubernetes for its ability for application and resource management. However, without good application observability, it may hurt developer velocity, reducing it to a buzzword at best. It might even add unnecessary stress on both DevOps and Product engineering teams. Fortunately, as the ecosystem matures we are seeing more vendor support, thus gave birth to this post. I’m super pumped for the ongoing trajectory.
You may find the complete source code for this post in https://github.com/bufferapp/dd-tracing-logging-examples. Cheers!
Originally published at http://github.com.
The original article published on Medium.
