By guillaume blaquiere.Aug 5, 2021

In cloud environments, it’s common to create and destroy resources as we need them. It’s also common to strongly separate the resources for security or confidentiality reasons; or simply to limit the blast radius in case of incidents.
On Google Cloud, creating several projects, one per customer, each with the same app deployed is a common pattern, especially when you have project-dependent resources, such as App Engine or Firestore/Datastore.
You end up with one multi-tenant-service deployed in several single-tenant-projects
That’s for the design, but on day 2, you need to monitor your applications, dispatched in different projects.
In my case, to track errors, I’m used to defining several log-based metrics to filter only the relevant logs for my error cases. And then, I add a Cloud Monitoring alert on these metrics to notify the errors to the teams (using email, PubSub, …)
Multiple project logs
The issue when you have multiple projects is that you have several Cloud Logging instances, one per project, and it’s hard to monitor all the projects at the same time, in the same place.
In addition, when you set a log-based metrics, you can only filter in the current project and you can’t set the filter at the folder or organisation level.
Because the deployed code in the different projects is the same, it’s not relevant to have to duplicate the log-based metrics and the alerts in each project. Doing so in a single place is more efficient and consistent!
Sinks at the folder and organisation level
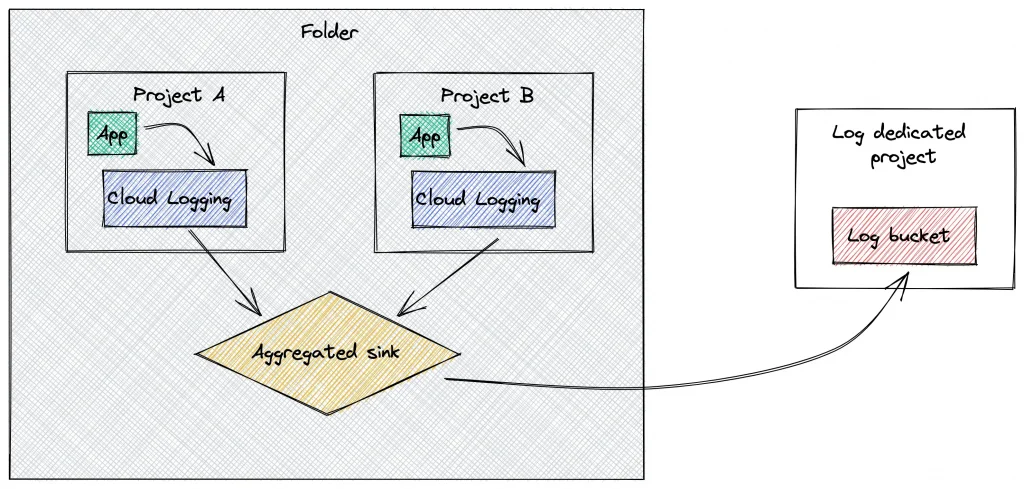
Thankfully, it’s possible to filter logs at the folder and organisation level with a sink. The trick here is the capacity to include child nodes at the folder and organisation level.
The child node for a folder and for an organisation are the folders and the projects. Therefore, if you include the children in your sink, you also add all the folders and the projects (recursively).
The feature is named “aggregated sinks”. You can get the filtered logs from all child nodes and sink them in BigQuery, PubSub, Cloud Storage and Log Bucket.
Sadly, it’s only a log forwarding and you can’t define a log-based metrics on an aggregated sink. You need to add something else!
Cloud Logging buckets
The solution comes from the Cloud Logging service itself. You can now define Log Buckets. It’s a user-defined log storage where you can route the logs and keep them for a user-defined retention period (in days).
This feature is interesting to keep the logs for a legal period, for example 3 years. In our case, the retention isn’t very important, we only want to have the logs in a single place!
Keep in mind that the longer you keep your logs for, the more storage you use, and the more you pay for it.
Sink into a Cloud Logging log bucket
The combination of the aggregated sinks and the log bucket is the key.

Here’s how to make them in action.
- Start by creating the resource organisation that you need, for example, create a folder with 2 projects in it.
- Then, create a similar log entry in the 2 projects, for instance run a BigQuery query that fails
SELECT * FROM 'bigquery-public-data.austin_311.311_service_requests' where unique_key=3
To view the error in the log, go to Cloud Logging and use this filter.
resource.type="bigquery_resource"
severity=ERROR
protoPayload.methodName="jobservice.jobcompleted"
Get this log filter for later.
- Choose a log dedicated project. It can be one of the 2 projects or in another ones. And then, create a log bucket
gcloud logging buckets create --location=global \
  --retention-days=7 --project=LOG_PROJECT_ID specific-log
- Then create an aggregated sink on your folder (this works also with the
--organizationparameter to create it at the organisation level)
gcloud logging sinks create --folder=<FOLDER_ID> \
  --log-filter='resource.type="bigquery_resource"
   AND severity=ERROR
   AND protoPayload.methodName="jobservice.jobcompleted"'\
  --include-children sink-specific-logs \
logging.googleapis.com/projects/<LOG_BUCKET_PROJECT_ID>/locations/global/buckets/specific-log
- Finally, run again your erroneous BigQuery query.
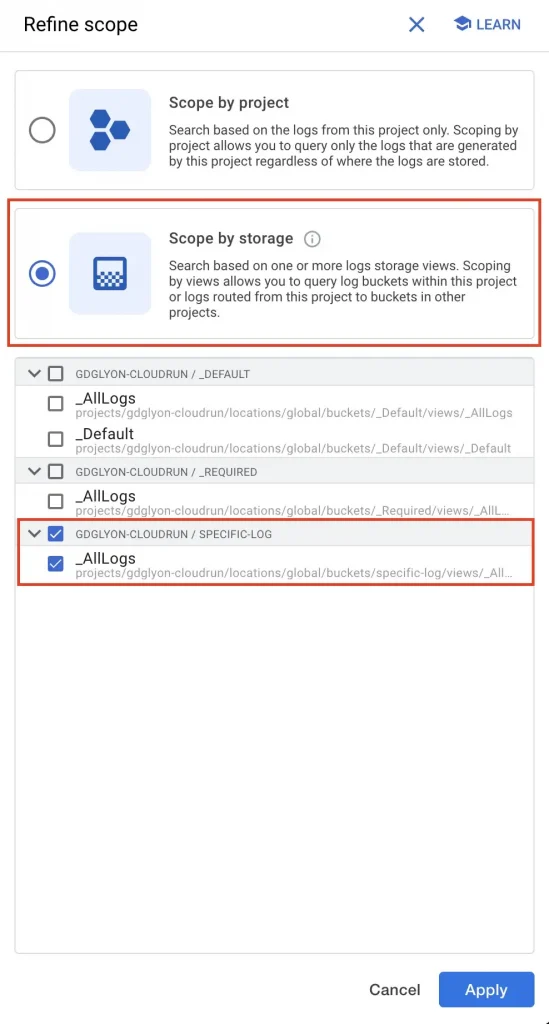
Now, check the new log entries in the Cloud Logging log bucket. To achieve that
- Go to the Cloud Logging page and click on
refine scope

- Select the
scope by storageoption, and select only yourspecific-logslog bucket

Nothing happens, no log entries and no errors, it’s disturbing…
Actually, it’s a security issue: the aggregated sink created at the folder level doesn’t have the permission to write to the log bucket!
To solve that, we need to get the writerIdentity of the aggregated sink
gcloud logging sinks describe --folder=<FOLDER_ID>\
 --format='value(writerIdentity)' sink-specific-logs
And finally grant the writerIdentity service account as log bucket writer on the log-dedicated project.
gcloud projects add-iam-policy-binding <PROJECT_ID> \
  --member=<WRITER_IDENTITY> --role=roles/logging.bucketWriter
Try again your BigQuery query and Boom!!
You have your logs in your log bucket.
Centralise your logs and play with them
Now, you can have all your relevant logs, of all your apps’ tenant in a single place and you can do what you want with them
- Keep them for a long/legal time
- Grant a team to access only to this log dedicated project to have access to the logs but not to the tenant projects (and the data)
- Create log based metrics in a single and aggregated place.
What about you, what’s your use case with having all the logs in the same place?
The original article published on Medium.
