By Gilang Virga Perdana.Jun 12, 2023
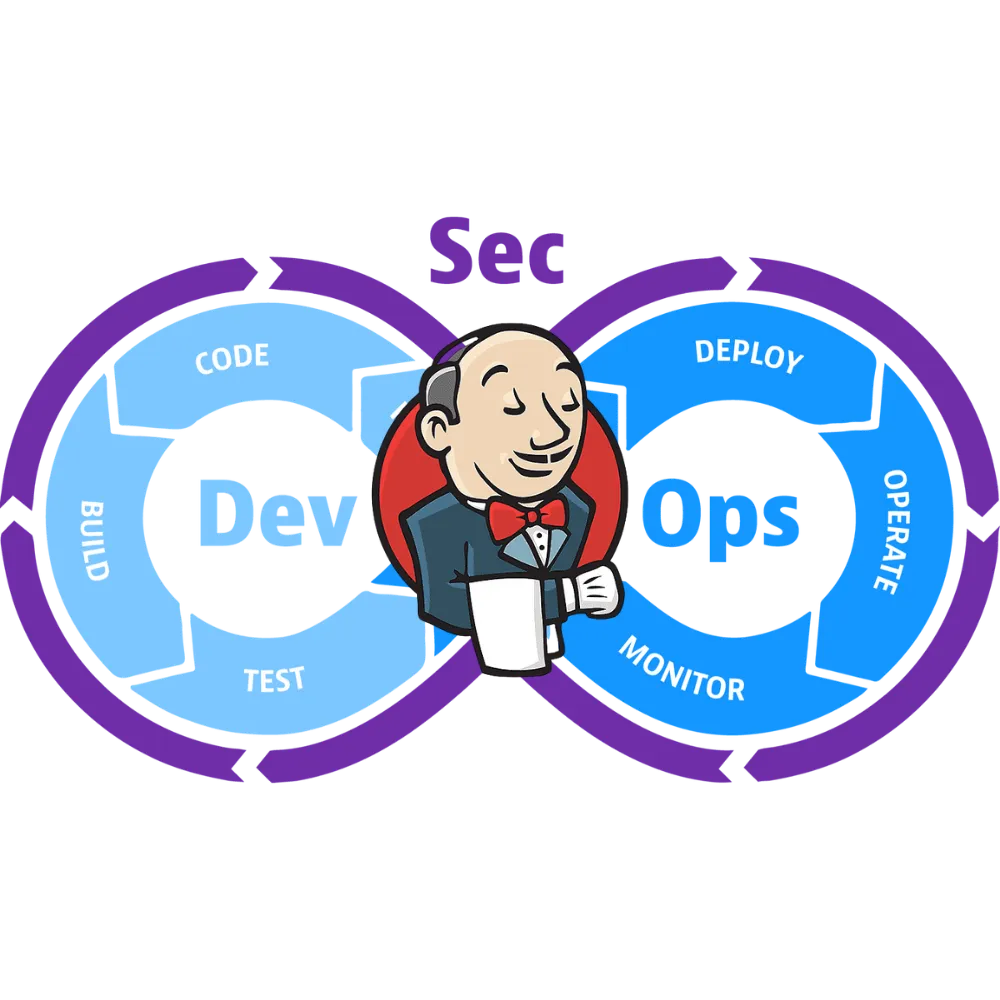
Exploring DevSecOps: the answer to problems related to developing applications and rising cybercrime.
In this modern era, the development of applications is very massive, and of course, cybercrime is becoming crazier. I have become interested in learning a little bit about SDLC automation, or what is often called DevOps culture. However, this time, I have tried several additional security platforms so it can be DevSecOps.
In general, I will use Jenkins as the CI/CD platform, then Dependency Track as SCA, SonarQube as SAST, Trivy for Container Image Scanner and Defectdojo as the centralized report monitoring.
On the infrastructure side, I am using Kubernetes as the staging container for my experiments with several self-hosted platforms, such as Harbor as a private container registry & ArgoCD for the Continuous Deployment Platform.
The pipeline goals that I use are as follows :
Clone Repository Stage
first, I declare clone code from SCM, here I use GitHub for host my example js code. At that stage I declared the Jenkinsfile as follows :
stage('Clone Repository') {
  steps {
    script {
      sourceCodeDir = sh(
        script: 'pwd',
        returnStdout: true
      ).trim()
      git branch: 'staging',
          url: 'https://github.com/gilangvperdana/react-code.git'
      env.CI_COMMIT_SHORT_SHA = sh(
        script: 'git log --pretty=format:\'%h\' -n 1',
        returnStdout: true
      ).trim()
    }
  }
}
Generate SBOM Stage
Secondly, I will generate a BOM file that will be sent to Dependency Track and DefectDojo for analysis purposes. The tools namely cdxgen. At that stage i declared as follows :
    stage('Generate SBOM') {
      steps {
          dir(sourceCodeDir) {
            sh "cdxgen"
          }
      }
    }
After this stage, our workspace should generate two files named ‘bom.json’ and ‘bom.xml’.
Send bom.xml to Dependency Track & Defectdojo Stage
Here, I use the Dependency Track API, which usually runs on port “8081”, and I utilize a third-party tool called dd-import to send it to DefectDojo.
    stage('Send to Dependency Track & Defect Dojo') {
      steps {
        script {
          def projectVersion = "${env.BUILD_NUMBER}"
          dir(sourceCodeDir) {
            sh '''
            curl -X "POST" "$DEPTRACK_URL:8081/api/v1/bom" -H 'Content-Type: multipart/form-data' -H "X-Api-Key: $DEPTRACK_API_KEY" -F "autoCreate=true" -F "projectName=website" -F "projectVersion=''' + projectVersion + '''" -F "bom=@bom.xml"
            '''
            sh '''
            docker run --rm -e "DD_URL=$DD_URL" -e "DD_API_KEY=$DD_API_KEY" -e "DD_PRODUCT_TYPE_NAME=Research and Development" -e "DD_PRODUCT_NAME=website" -e "DD_ENGAGEMENT_NAME=Dependency Track" -e "DD_TEST_NAME=dependency-track" -e "DD_TEST_TYPE_NAME=Dependency Track Finding Packaging Format (FPF) Export" -e "DD_FILE_NAME=website/bom.json" -v "${WORKSPACE}:/usr/local/dd-import/website" maibornwolff/dd-import:latest dd-reimport-findings.sh
            '''
          }
        }
      }
    }
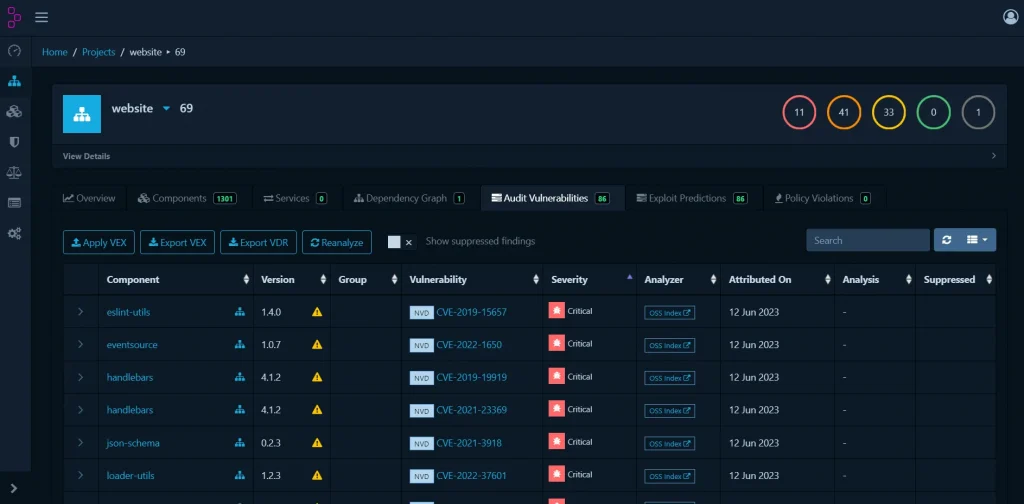
This is what the Dependency Track looks like once it has been sent via the API.
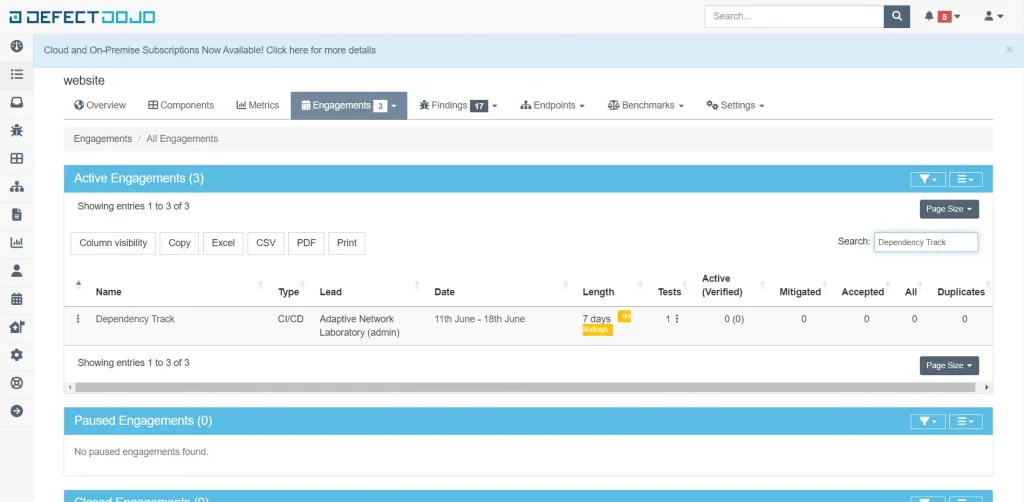
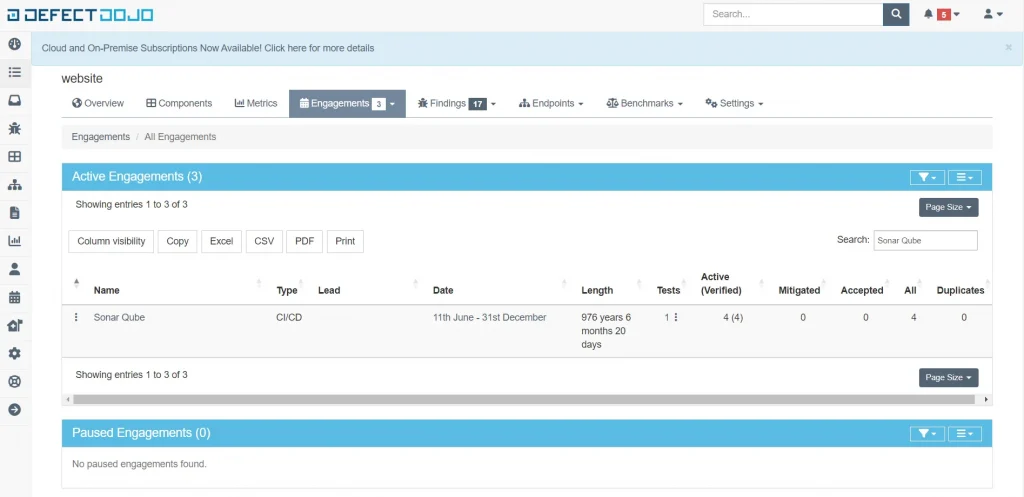
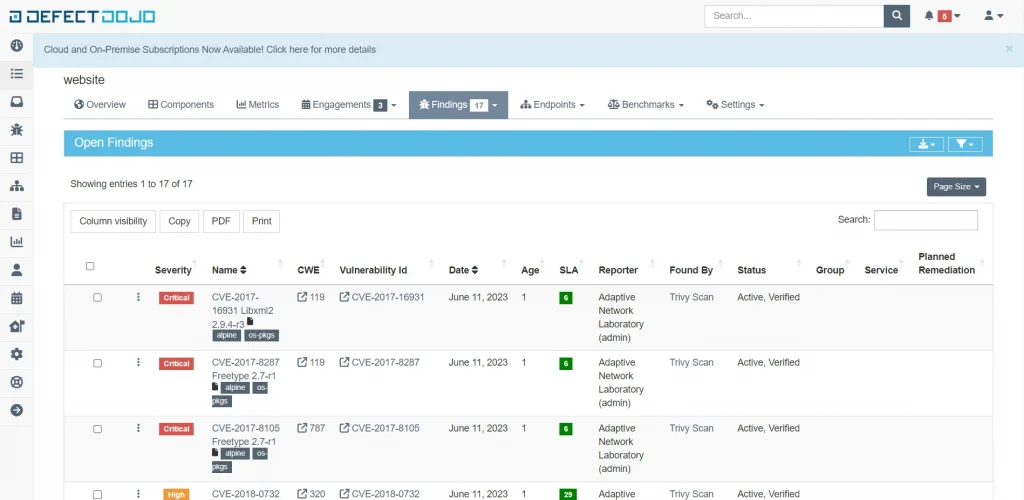
Likewise with Defectdojo, which can be seen in the image below, engagements have already been made on the product website.
Sonarqube SAST Stage
This is the time to scan our source code using SonarQube or what is often called SAST. Here, I use the SonarScanner as the CLI. Make sure you have created a file called sonar-project.properties in your code repository with the contents sonar.projectKey=website. Replace website with the actual name of the project you will create in Sonarqube.
    stage('SonarQube - SAST') {
      steps {
        withSonarQubeEnv('SonarQube') {
          dir(sourceCodeDir) {
            sh "sonar-scanner -Dsonar.projectKey=website -Dsonar.host.url=$SONAR_URL -Dsonar.login=${SONARQUBE_SECRET}"
          }
        }
        timeout(time: 2, unit: 'MINUTES') {
          script {
            waitForQualityGate abortPipeline: true
          }
        }
      }
    }
The script after the scan is the Quality Gate, which is owned by SonarQube and can be installed using the Jenkins Plugin. After that, we can set a webhook on SonarQube, as shown below, which is useful so that SonarQube can communicate with Jenkins if the results of our analysis don’t match the rules we specified. This will eventually stop the pipeline.
Send Sonarqube to DefectDojo Stage
of course, the results from SonarQube make it easier for us to directly send them to Defectdojo using dd-import. But before that, we need to obtain an HTML report from SonarQube so that it can be imported into DefectDojo using the sonar-report tool.
    stage('Send Sonarqube to DefectDojo') {
      steps {
          sh '''
          sonar-report --sonarurl="$SONAR_URL" --sonartoken ${SONAR_TOKEN} --sonarcomponent="website" --sonarorganization="website" --project="website" --application="website" --release="1.0.0" --branch="main" --output="sonarreport.html"
          '''
          sh '''
          docker run --rm -e "DD_URL=$DD_URL" -e "DD_API_KEY=${DD_API_KEY}" -e "DD_PRODUCT_TYPE_NAME=Research and Development" -e "DD_PRODUCT_NAME=website" -e "DD_ENGAGEMENT_NAME=Sonar Qube" -e "DD_TEST_NAME=sonar-qube" -e "DD_TEST_TYPE_NAME=SonarQube Scan detailed" -e "DD_FILE_NAME=website/sonarreport.html" -v "${WORKSPACE}:/usr/local/dd-import/website" maibornwolff/dd-import:latest dd-reimport-findings.sh
          '''
        }
      }
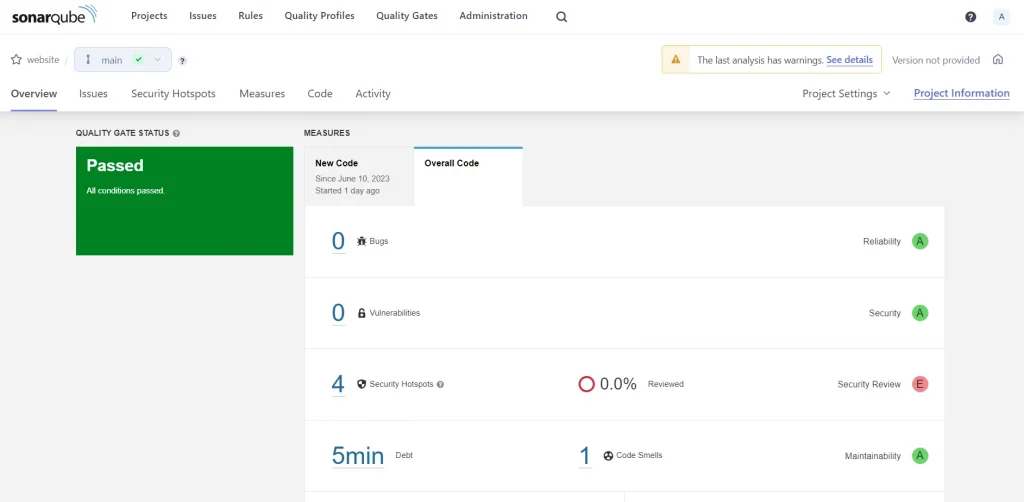
This is what SonarQube looks like when the report is successfully analyzed.
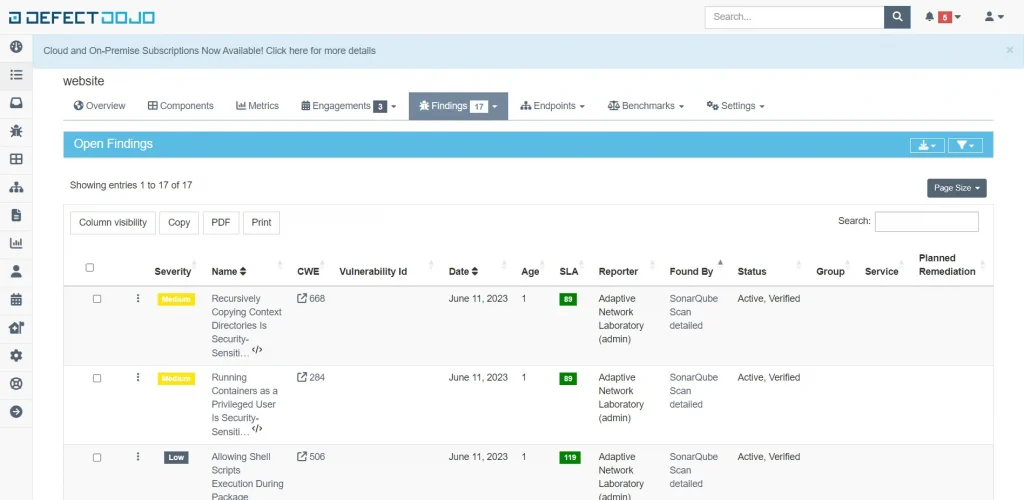
And this is how SonarQube reports look after being integrated into Defectdojo.
Build Image Stage
Then the next stage is to create a Docker Image that is used for the scanning process using Trivy.
    stage('Docker Build') {
      steps {
          sh '''
          docker build -t $HARBOR_URL/temp/research:${CI_COMMIT_SHORT_SHA} .
          '''
        }
      }
Trivy Scan Image Stage
After the container image is created in the Jenkins VM, the next stage is to scan the image using Trivy, and the report will be sent to DefectDojo again.
    stage('Trivy Scan Image') {
      steps {
          sh 'trivy image --exit-code 0 --no-progress --severity HIGH,CRITICAL -f json -o trivy_report.json $HARBOR_URL/temp/research'
        }
      }
After this stage, it should generate a file named trivy_report.json.
Send Trivy Report to Defectdojo
We will send the report results to DefectDojo for better observability.
    stage('Send Trivy Report to Defectdojo') {
      steps {
          sh '''
          docker run --rm -e "DD_URL=$DD_URL" -e "DD_API_KEY=$DD_API_KEY" -e "DD_PRODUCT_TYPE_NAME=Research and Development" -e "DD_PRODUCT_NAME=website" -e "DD_ENGAGEMENT_NAME=Trivy" -e "DD_TEST_NAME=trivy" -e "DD_TEST_TYPE_NAME=Trivy Scan" -e "DD_FILE_NAME=website/trivy_report.json" -v "${WORKSPACE}:/usr/local/dd-import/website" maibornwolff/dd-import:latest dd-reimport-findings.sh
          '''
        }
      }
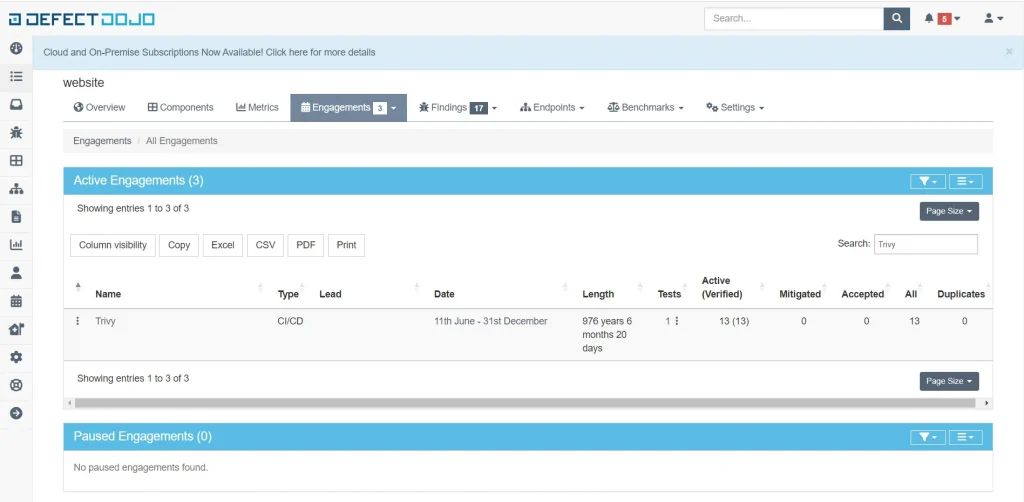
This is an example of what it looks like after Trivy has been successfully sent to DefectDojo.
Push Image Stage
After that, we will push the image to Harbor for testing in the Staging environment, along with performing an Ops analysis in DefectDojo.
    stage('Push Image'){
        steps {
            sh 'docker push $HARBOR_URL/temp/research:${CI_COMMIT_SHORT_SHA}'
            sh 'docker rmi $HARBOR_URL/temp/research:${CI_COMMIT_SHORT_SHA}'
        }
    }
The following is the display on Harbor after the image has been successfully pushed.
Change Image Tag Staging on GitHub
The approach I use involves changing the image tag in the Git Repository, which contains the manifest in the staging folder. Then, it is fetched via ArgoCD for deployment to Kubernetes. The command I use in the Jenkinsfile to change the image tag is as follows :
    stage('Change Image Tag on Github'){
        steps {
            script{
                env.GIT_URL = sh (
                    script: 'echo @github.com/gilangvperdana/EXAMPLE.git'">https://oauth2:${access_token_PSW}@github.com/gilangvperdana/EXAMPLE.git',
                    returnStdout: true
                ).trim()
            }
            dir('react-manifest-staging'){
                git branch: 'main',
                    credentialsId: 'github_access_token',
                    url: "$GIT_URL"
                sh 'git config user.email bot@email.com && git config user.name ci-bot'
                sh 'sed -i "s+$HARBOR_URL/temp/research:.*+$HARBOR_URL/temp/research:${CI_COMMIT_SHORT_SHA}+g" infra/staging/deployment.yaml'
                sh 'git add . && git commit -m "update staging research image tag to ${CI_COMMIT_SHORT_SHA}"'
                sh 'git push origin main'
            }
        }
    }
I use git log --pretty=format:\'%h\' -n 1 as the image tag, where the image tag will follow the last commit number in the code repository. I did this to make it easier to trace and rollback versions, among other things.
ArgoCD Sync Staging
I used ArgoCD CLI to attempt deployment to a Kubernetes staging environment, resulting in a staging outcome similar to the one shown in the Jenkinsfile. My ArgoCD configuration follows this reference.
    stage('ArgoCD Sync Staging'){
        steps {
            withCredentials([string(credentialsId: "ARGOCD_TOKEN", variable: 'ARGOCD_TOKEN')]) {
                dir('react-manifest-staging'){
                    git branch: 'main',
                        credentialsId: 'github_access_token',
                        url: "https://github.com/gilangvperdana/EXAMPLE.git"
                    sh 'ARGOCD_SERVER=$ARGOCD_URL argocd --grpc-web app create research-service-staging --project default --repo https://github.com/gilangvperdana/EXAMPLE.git --path ./infra/staging/ --revision main --dest-namespace staging --dest-server https://kubernetes.default.svc --upsert'
                    sh 'argocd --grpc-web app sync research-service-staging --force'
                }
            }
        }
    }
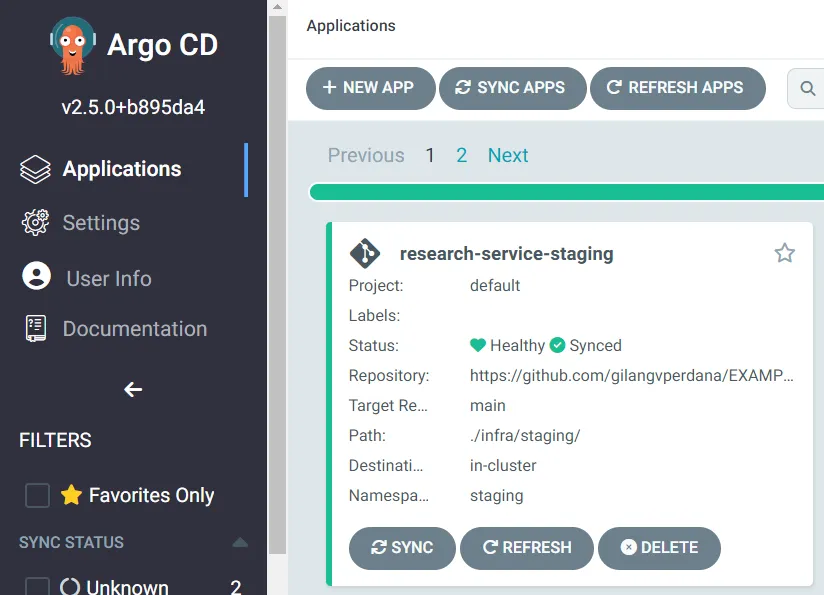
This is an example that has been successfully deployed to a Kubernetes cluster using ArgoCD.
Send Approval Deploy to Prod
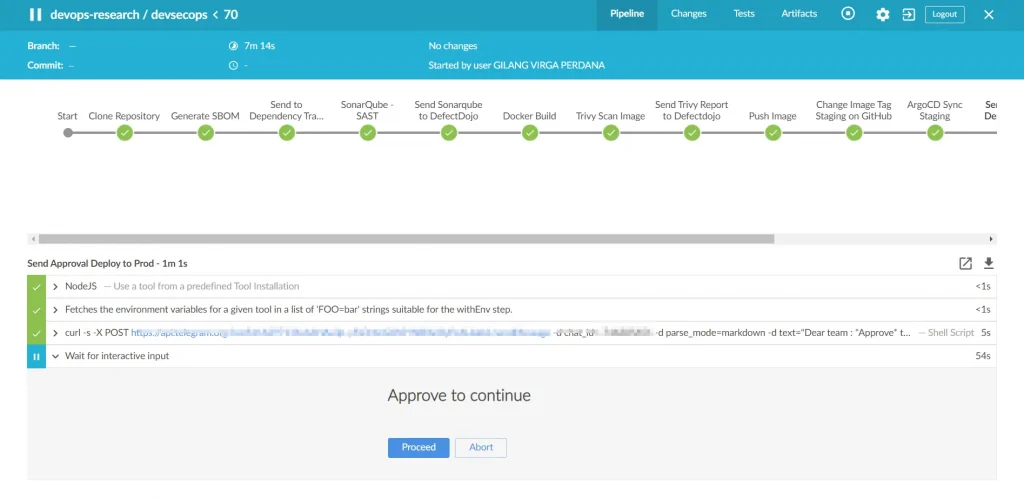
After the IT team approves the analysis on DefectDojo and the Staging Application, I usually proceed with this stage. In this stage, the IT Team Leader will provide their approval. This plugin allows only specific Jenkins accounts to grant approval. Once approved, it will proceed to replace the TAG Image in the Manifest Repository production folder. Subsequently, it will be fetched by ArgoCD in the Production namespace.
    stage('Send Approval Deploy to Prod'){
      steps{
        script{
          sh ("""
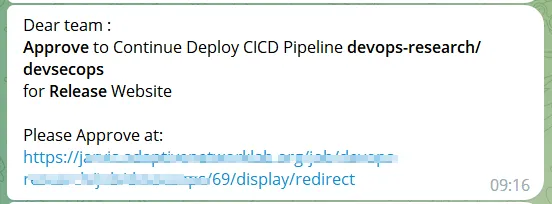
          curl -s -X POST https://api.telegram.org/bot$BOT_TOKEN/sendMessage -d chat_id=$TELEGRAM_CHATID -d parse_mode=markdown -d text="Dear team : \n*Approve* to Continue Deploy CICD Pipeline *${env.JOB_NAME}* \nfor *Release* Website \n\nPlease Approve at: ${env.RUN_DISPLAY_URL}"
          """)
            input(message: 'Approve to continue', submitter: "teamleader@email.com", submitterParameter: "teamleader@email.com")
        }
      }
    }
The approval message will be sent to Telegram, similar to the example below.
And if we click it will be redirected to the following page:
If it is approved, the pipeline will proceed to the next stage. If it is not approved, the pipeline will proceed directly to the final stage.
Change Image Tag Production on GitHub Stage
After being approved, the stage of deploying to production will automatically proceed, resulting in an immediate replacement of the image tag in the production repository.
    stage('Change Image Tag on Github'){
        steps {
            script{
                env.GIT_URL = sh (
                    script: 'echo @github.com/gilangvperdana/EXAMPLEPROD.git'">@github.com/gilangvperdana/EXAMPLEPROD.git'">https://oauth2:${access_token_PSW}@github.com/gilangvperdana/EXAMPLEPROD.git',
                    returnStdout: true
                ).trim()
            }
            dir('react-manifest-production'){
                git branch: 'main',
                    credentialsId: 'github_access_token',
                    url: "$GIT_URL"
                sh 'git config user.email bot@email.com && git config user.name ci-bot'
                sh 'sed -i "s+$HARBOR_URL/temp/research:.*+$HARBOR_URL/temp/research:${CI_COMMIT_SHORT_SHA}+g" infra/production/deployment.yaml'
                sh 'git add . && git commit -m "update production research image tag to ${CI_COMMIT_SHORT_SHA}"'
                sh 'git push origin main'
            }
        }
    }
ArgoCD Sync Prod Stage
Same as argosync staging, the only difference lies in the GitHub repository and the deployment namespace.
    stage('ArgoCD Sync Production'){
        steps {
            withCredentials([string(credentialsId: "ARGOCD_TOKEN", variable: 'ARGOCD_TOKEN')]) {
                dir('react-manifest-production'){
                    git branch: 'main',
                        credentialsId: 'github_access_token',
                        url: "https://github.com/gilangvperdana/EXAMPLEPROD.git"
                    sh 'ARGOCD_SERVER=$ARGOCD_URL argocd --grpc-web app create research-service-production --project default --repo https://github.com/gilangvperdana/EXAMPLEPROD.git --path ./infra/production/ --revision main --dest-namespace production --dest-server https://kubernetes.default.svc --upsert'
                    sh 'argocd --grpc-web app sync research-service-production --force'
                }
            }
        }
    }
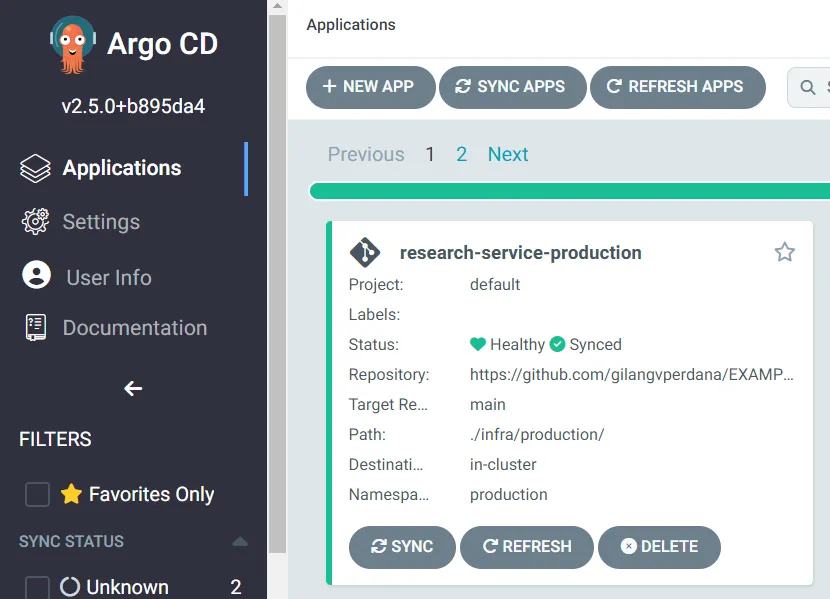
And this is how it works when it is successfully deployed to ArgoCD, which will then automatically deploy to Kubernetes as well.
Post Stage
This final stage is responsible for cleaning up the environment and sending alerts regarding the results of the executed pipeline, indicating whether it was successful, failed, or other statuses. Typically, I utilize it in the following manner :
    post {
        always {
            deleteDir()
            dir("${workspace}@tmp") {
                deleteDir()
            }
            dir("${workspace}@script") {
                deleteDir()
            }
        }

       success {
          sh  ("""
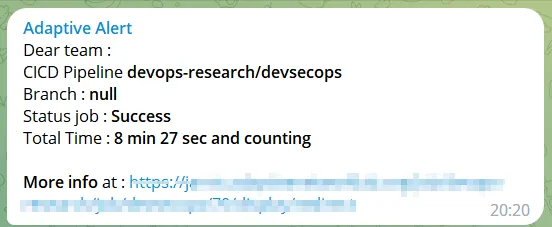
              curl -s -X POST https://api.telegram.org/bot$BOT_TOKEN/sendMessage -d chat_id=$TELEGRAM_CHATID -d parse_mode=markdown -d text=" Dear team : \nCICD Pipeline *${env.JOB_NAME}* \nBranch : *${env.BRANCH_NAME}* \nStatus job : *Success* \nTotal Time : *${currentBuild.durationString}* \n\n*More info* at : ${env.RUN_DISPLAY_URL}"
          """)
       }

       aborted {
          sh  ("""
              curl -s -X POST https://api.telegram.org/bot$BOT_TOKEN/sendMessage -d chat_id=$TELEGRAM_CHATID -d parse_mode=markdown -d text=" Dear team : \nCICD Pipeline *${env.JOB_NAME}* \nBranch : *${env.BRANCH_NAME}* \nStatus job : *Aborted* \nTotal Time : *${currentBuild.durationString}* \n\n*More info* at : ${env.RUN_DISPLAY_URL}"
          """)
       }

       failure {
          sh  ("""
              curl -s -X POST https://api.telegram.org/bot$BOT_TOKEN/sendMessage -d chat_id=$TELEGRAM_CHATID -d parse_mode=markdown -d text=" Dear team : \nCICD Pipeline *${env.JOB_NAME}* \nBranch : *${env.BRANCH_NAME}* \nStatus job : *Failed* \nTotal Time : *${currentBuild.durationString}* \n\n*More info* at:  ${env.RUN_DISPLAY_URL}"
          """)
       }

    }
The following is an example of how the alerting on the intended Telegram will appear once the pipeline has finished running :
Summary
Yup, up until this point, I have shared my exploration in the field of CI/CD. I apologize for any shortcomings, and I encourage you to further explore the world of CI/CD to continue assisting developers in this realm. Thank you.
Further Reading
The original article published on Medium.


