By Ewa Wojtach.Dec 16, 2022
Creating GKE cluster seems to be an easy task. One cluster can be created in a few simple clicks in the UI console, or one terraform- or gcloud- command.
Going deeper, however, you can find a lot of detailed settings and parameters and things start to be a little more complicated. How to find out the right configuration? Are the defaults always the best choice? How to ensure, that your cluster is well secured, scalable and fulfils high availability requirements?
There are several Google provided documentations and best practices you can walk through. And that is the great source of knowledge. However, putting this knowledge into practice, which means checking all of them manually on all your clusters… That is not exciting, that is boring, that is a toil!
The good news is, that you do not have to do this manually. You can use GKE Policy Automation — automated, free to use, open source tool to discover and check your GKE clusters against the set of best practices.
Let’s start then, and check the simple cluster
We need to log into cloud shell with the roles/container.clusterViewer IAM role on cluster projects. Let’s go with:
gcloud auth application-default login
command to get application default credentials.
The next step is to create the configuration file with the details of clusters that we want to check. Lets then create dedicated directory, (eg. gpa-config/) and put there file config.yaml. The simplest configuration, could be:
clusters:
  - name: cluster1
    project: project-1
    location: europe-west3
  - name: cluster2
    project: project-1
    location: us-central1
  - name: cluster3
    project: project-2
    location: europe-central1
Alternatively, with one more IAM role (roles/cloudasset.viewer) we can simplify the configuration even more, and run the tool with automatic cluster discovery on the organization, folder or project level. In this case, our config file can look like this:
clusterDiscovery:
  enabled: true
  organization: "123456789012"
The last thing we need to perform, is to run the tool. We can use the docker container for that:
docker run --rm -v ~/gpa-config/config.yaml:/temp/config.yaml
    ghcr.io/google/gke-policy-automation check --config /temp/config.yaml
and tadaaam…

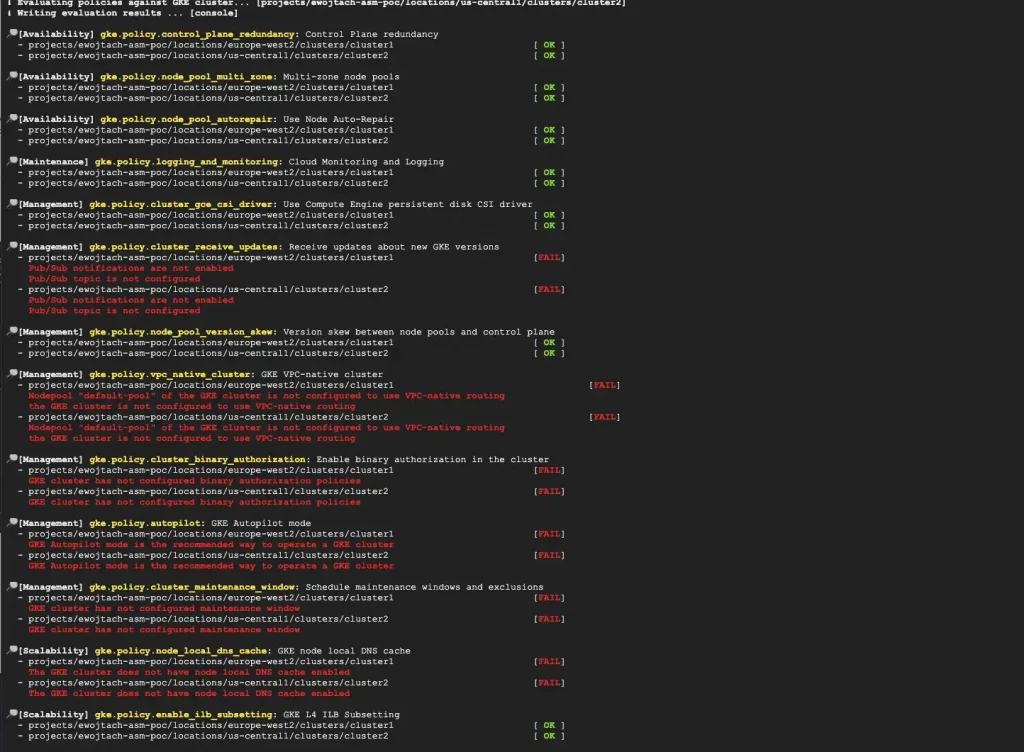
On the console output one can see results of clusters validation against set of best practice policies.
What have been checked?
Initial set of more than thirty policies is maintained within the GKE Policy Automation project. Rules embedded within the policies come from both GKE product official documentation, as well as from Google Professional Services team experience. They are divided into several categories:
- Security
- Maintenance
- Management
- Availability
- Scalability
To give just a few examples what we have just checked:
- for Security, there are, among others, checks of cluster control plane exposure, how the access to control plane is authorised, how secrets are managed and if there is proper scope of service account permissions.
- Availability is checked via usage of regional control plane and regional node pools, node auto-repair configuration.
- Cluster management and maintenance categories cover checks of the network configuration, versions and update settings.
- Scalability policies check autoscaling options, proper usage of Node Auto-Provisioning and local DNS cache usage.
You can also specify your own organisation best practices and attach them to the GKE Policy Automation tool.
Great, but what to do with the results?
So far, so good! We now know what to fix! Isn’t it great time to roll up your sleeves and start fixing clusters configuration? Not so fast… there is one more thing we can do with the tool, to ensure that our cluster config will not drift again.
Above, I have described only the simplest use-case and the simplest possible configuration to run the tool. But, imagine, that you can have the tool running in the background and checking all your clusters configuration on a daily / weekly basis. And showing you the results in Security Command Center console. Actually… it is already there! There is even more detailed blog post describing this use-case 🙂
Happy reading, configuring and fixing!
The views expressed are those of the author and don’t necessarily reflect those of Google.
The original article published on Medium.
